
Last Hope For Holding: August CPI Print Preview
Published September 10, 2026
Download PDF- The base effect that flattered the last two prints has run out. Kalshi prices August headline CPI at 3.3% YoY with core at 2.4%, but the monthly pace steps up sharply, to roughly +0.4% headline against July’s realized +0.1%. Integrating the full ladder of contracts puts the market-implied mean at 3.38% as of September 9, above the curve reading and skewed upward. The distribution, not the point, is the number to read.
- Gasoline reloaded rather than retraced. Kalshi’s August gasoline contract has moved from 18.0% YoY on August 10 to 27.6% now, tracking pump prices that never fell as far as the annual comparison implied. The exchange’s front-week gasoline contract has traded from roughly $4.06 to $4.16 over the past four weeks, with WTI back through $100 this morning. The offset comes from shelter and airfare, and those are the two assumptions with the most riding on them.
- The print lands five days before the FOMC decision the market has close to even. August payrolls at +162K against roughly 53K consensus removed the softest argument for standing still. Kalshi’s September FOMC market now has no-change near 50% against a 25bp hike in the mid-to-high forties, after sitting near 70% for a hold in mid-August. This is the last inflation reading the Committee sees.
The Bureau of Labor Statistics releases the August CPI report tomorrow, Friday September 11, at 8:30am ET, five days before the FOMC convenes on September 15–16 into a decision that is not settled. That sequencing is why this print carries more than the usual weight.
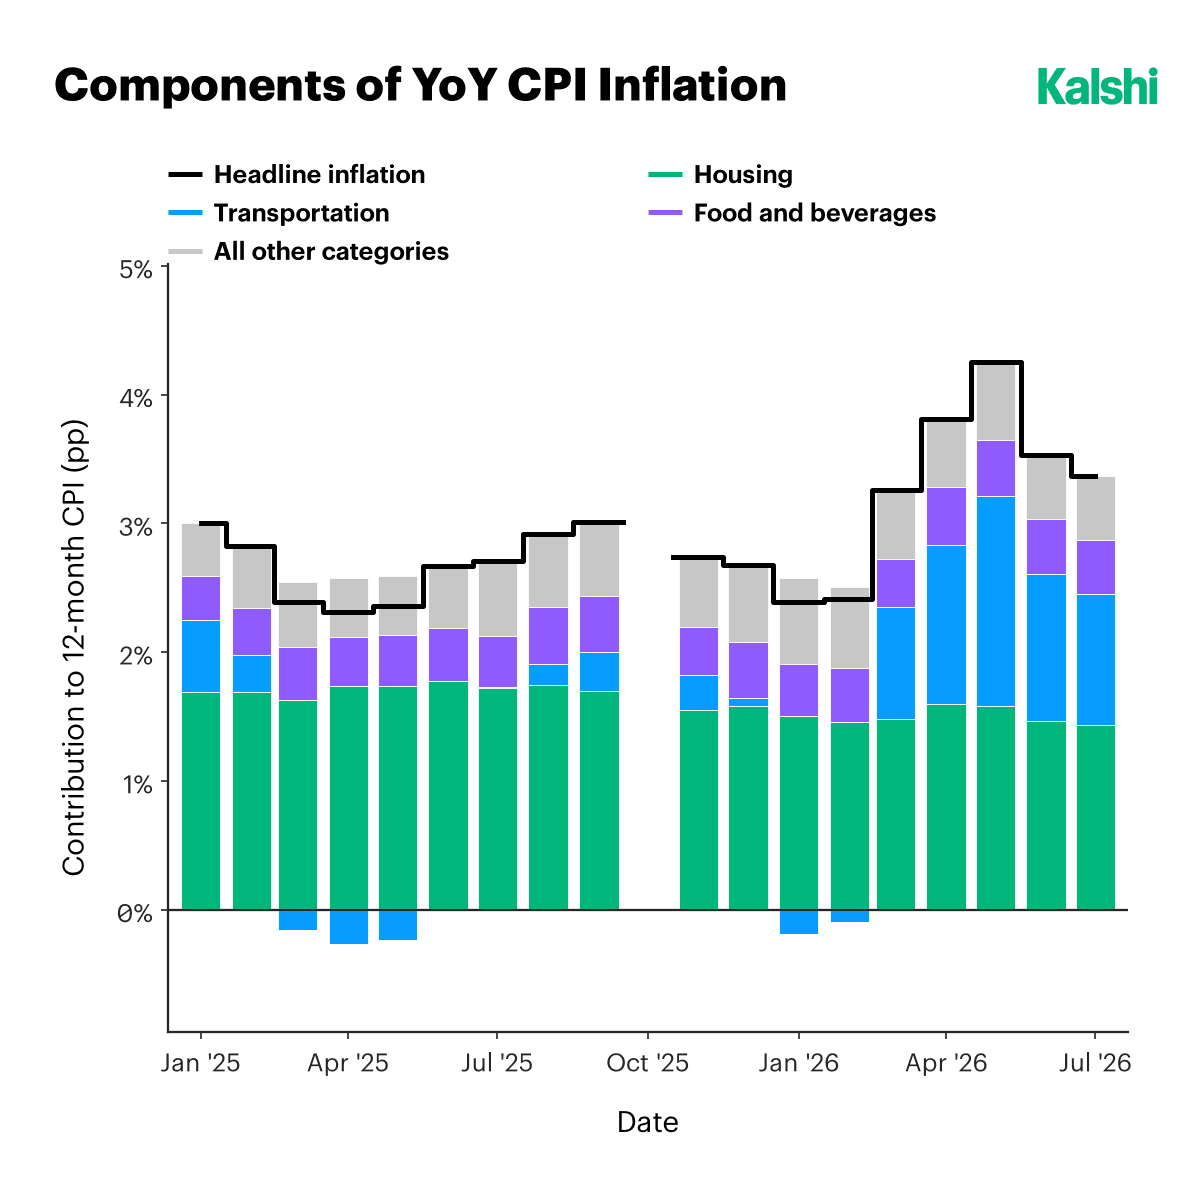
A year-over-year inflation print is the sum of two independent things: what prices did this month, and what they did in the month rolling out of the comparison a year ago. For most of 2025 those terms moved together and neither mattered much alone. Since the February 28 closure of the Strait of Hormuz they have decoupled violently, because the level shock landed in a single component with an unusually soft 2025 base underneath it. That is the whole mechanical story of this year: headline CPI climbing from 2.4% in January to a 4.2% peak in May was overwhelmingly a gasoline base effect running one way, and the retracement to 3.4% by July was the same base effect starting to run the other.
Last month we argued that the relief on offer was arithmetic rather than genuine cooling, and that the question worth watching was how much of the energy shock would survive the base effect. The answer is now visible in the contracts themselves. Kalshi’s August gasoline market has been repriced upward by nearly ten percentage points since August 10, and the monthly headline pace it prices for August is four times July’s realized figure. The base has stopped flattering the comparison. From here it starts working the other way, and the August print is where that turn first shows up in the data.
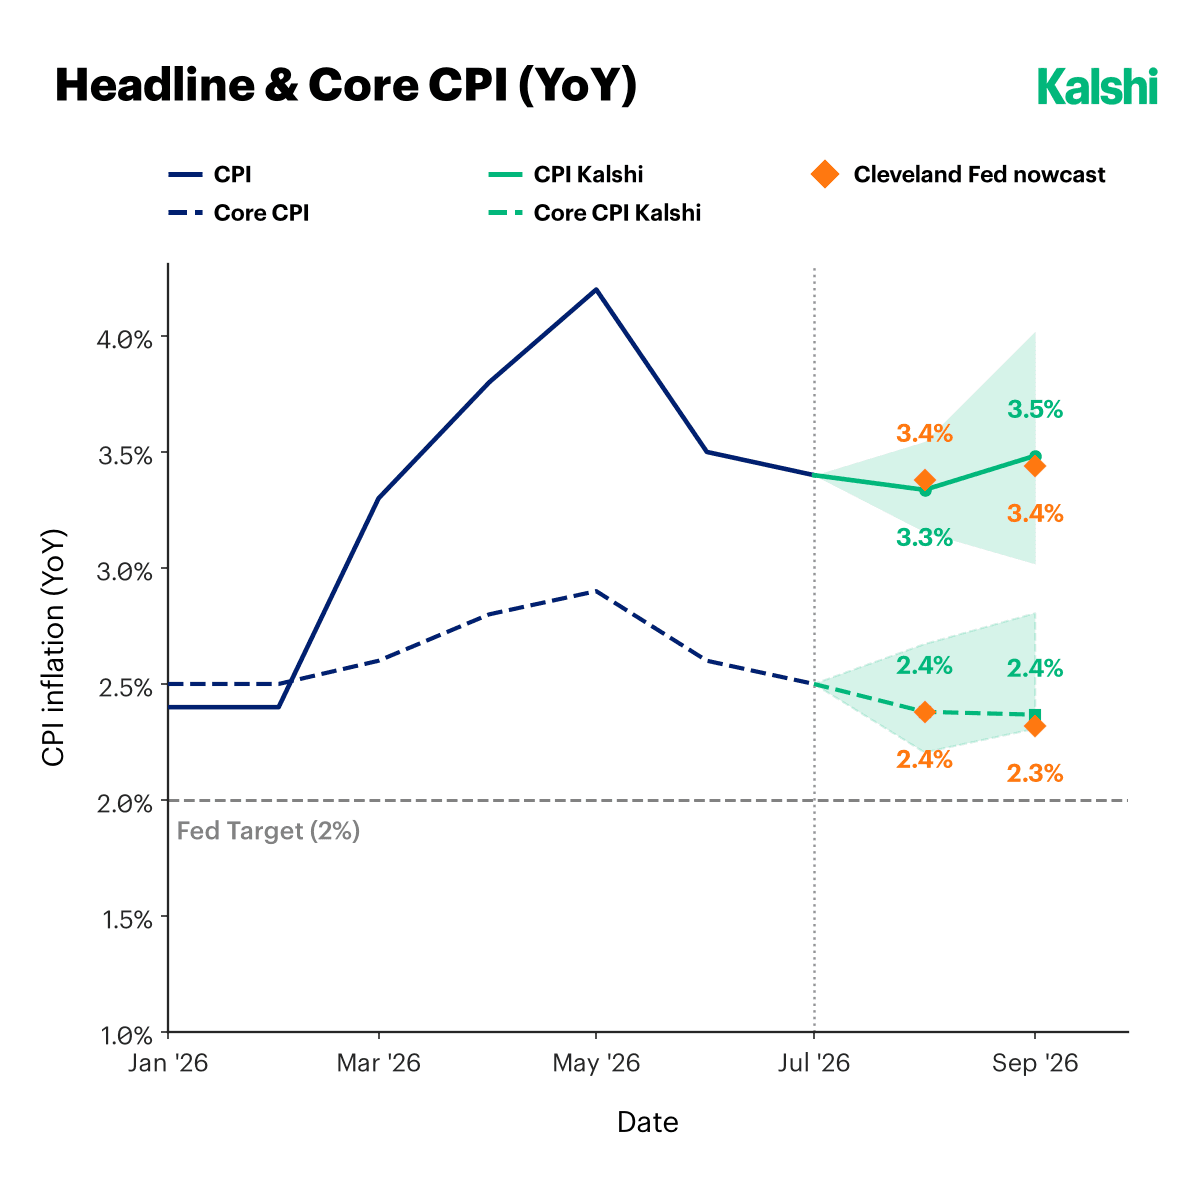
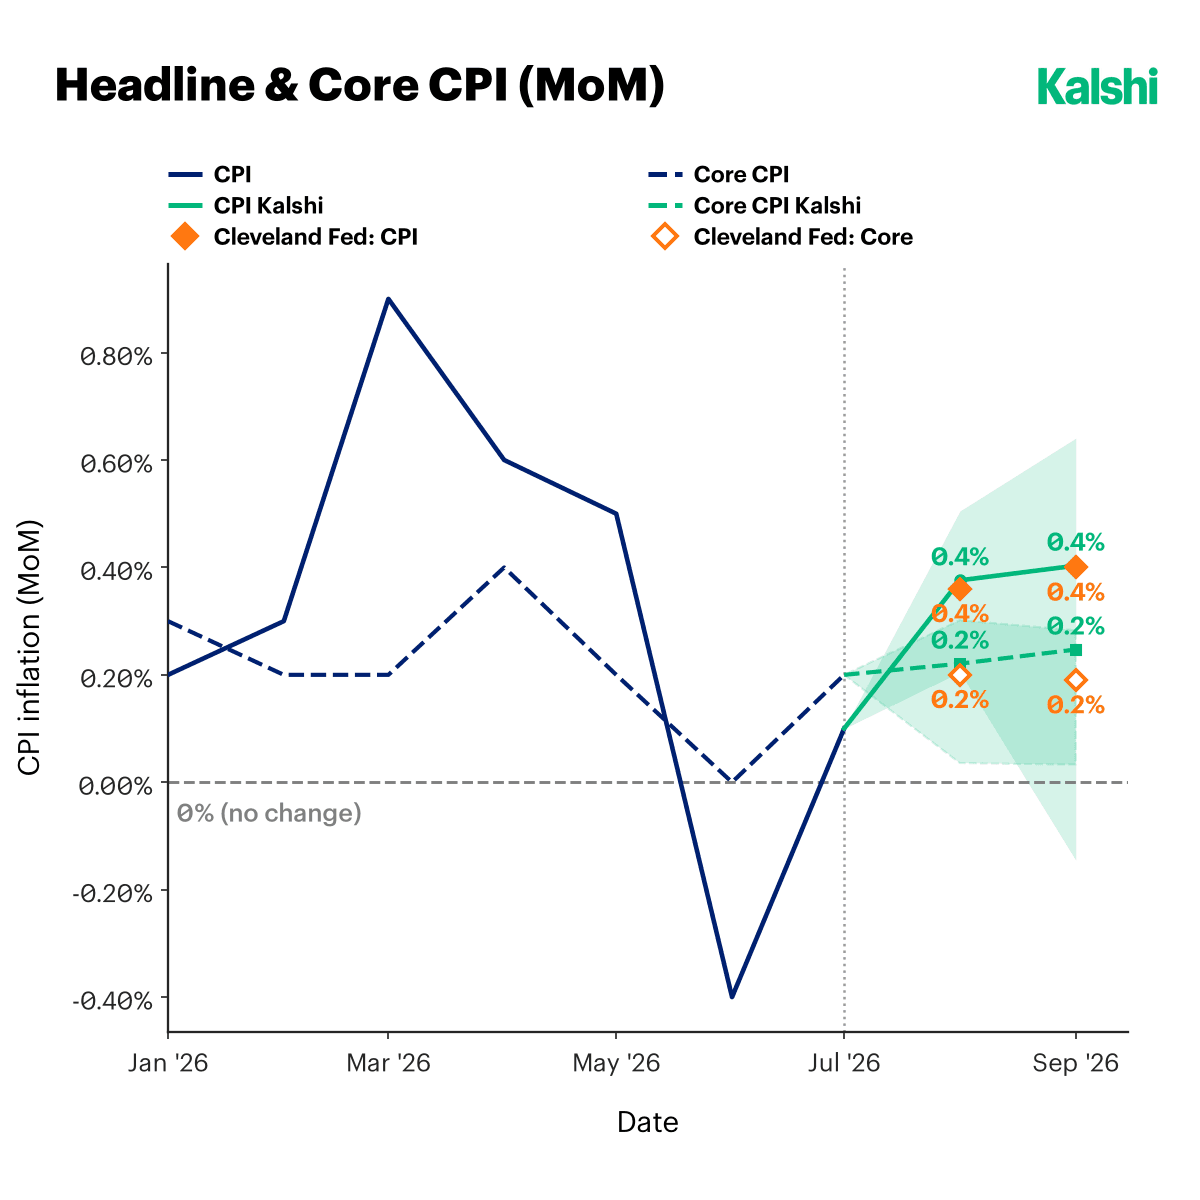
Official BLS data anchor the path. Headline CPI rose 0.1% on the month in July and 3.4% over twelve months, down from 3.5% in June, with shelter up 0.1% and accounting for roughly two-thirds of the monthly all-items increase. Core rose 0.2% on the month and 2.5% over the year. Energy fell 1.5% on the month after a 5.7% collapse in June but remains 14.7% higher than a year ago.
Against that, Kalshi’s forward curve prices August headline at 3.3% YoY with core at 2.4%, alongside a Cleveland Fed nowcast of 3.4% and 2.4% and a street consensus of 3.4%. The monthly figures are where the acceleration is legible: the market prices roughly +0.4% headline and +0.2% core, the firmest monthly headline reading since the spring. The two views cross in September, with Kalshi’s curve drifting up to 3.5% headline while the nowcast eases to 3.4%, and the market holding core at 2.4% where the nowcast has it slipping to 2.3%. The confidence band widens into September and, as it did last month, it widens upward. The centre of mass of Kalshi’s pricing sits between the two published point forecasts, with the upside tail carrying most of the weight.
New Kalshi Research, straight to your inbox.
Gasoline Reloaded Instead of Retracing
Gasoline CPI ran at 24.6% YoY in July, down from 26.7% in June and near-perfectly in line with the 24.4% Kalshi had priced a month in advance. That was the last clean deceleration in the series. Kalshi now prices August gasoline at 27.6% YoY, against the 18.0% the same contract implied on August 10. That is not a forecast revision in the ordinary sense; it is the market absorbing observed pump prices. The national average was $3.93/gal in July and $4.03/gal on the morning of the July CPI release. Against a 2025 August base near $3.05–$3.15/gal, a monthly average around $4.10 is a year-over-year increase in the high twenties, which is where the contract sits.
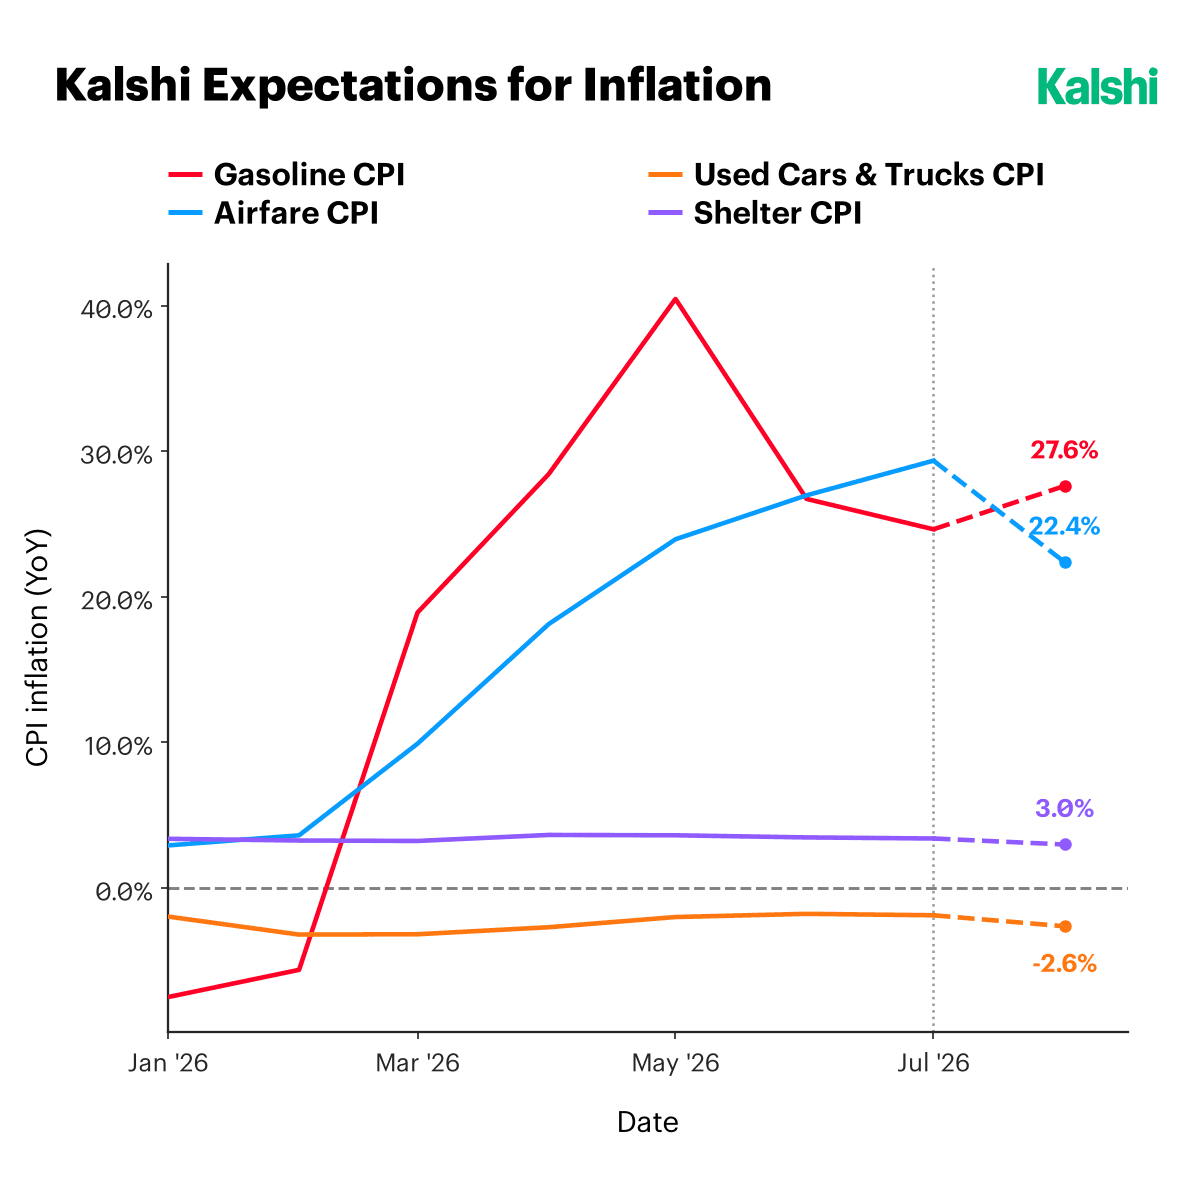
Kalshi’s weekly front-week gasoline contract is the highest-frequency instrument available on that question, and it has traded from roughly $4.06 to roughly $4.16 over the past four weeks, dipping around August 26–29 before climbing through the first week of September. WTI moved back through $100 this morning. Overlaid on the exchange’s August PPI market, which drifted from roughly 4.98% to 5.09% YoY over the same window against a 5.4% print this morning, the two series turn together. Energy is the common factor, and it is still moving up.
The Cost Layer Underneath Core Has Not Moved
Core has been the calm part of this episode, and the reason is worth restating because it is not benign. The Dallas Fed estimated in May that realized tariff collections added roughly 0.80pp to twelve-month core PCE inflation as of March 2026; Cavallo, Llamas and Vazquez found a comparable 0.76pp effect on all-items CPI as of September 2025, with pass-through close to dollar-for-dollar and a lag of around seven months. Applied loosely to July’s 2.5% core CPI, that puts the underlying non-tariff trend somewhere near 1.7–1.8%. These are third-party estimates resting on contested identification assumptions and should be read as orders of magnitude rather than precise figures; there is no tariff- or freight-specific contract listed on Kalshi to price them directly.
Layered on top, the Strait of Hormuz has been effectively closed to routine commercial shipping since February 28, forcing reroutes around the Cape of Good Hope and pushing freight costs higher on lanes with no direct Middle East exposure. Producer-side data continue to show that channel live: truck transportation of freight and courier services both rose again in August. Given the roughly seven-month pass-through window found in the tariff research, costs incurred during the worst of the closure are still working into landed prices now. That is the most defensible reason to expect the upside skew visible in Kalshi’s own confidence bands to persist into Q4, independent of what gasoline does next.
The Labour Market Has Stopped Providing Cover
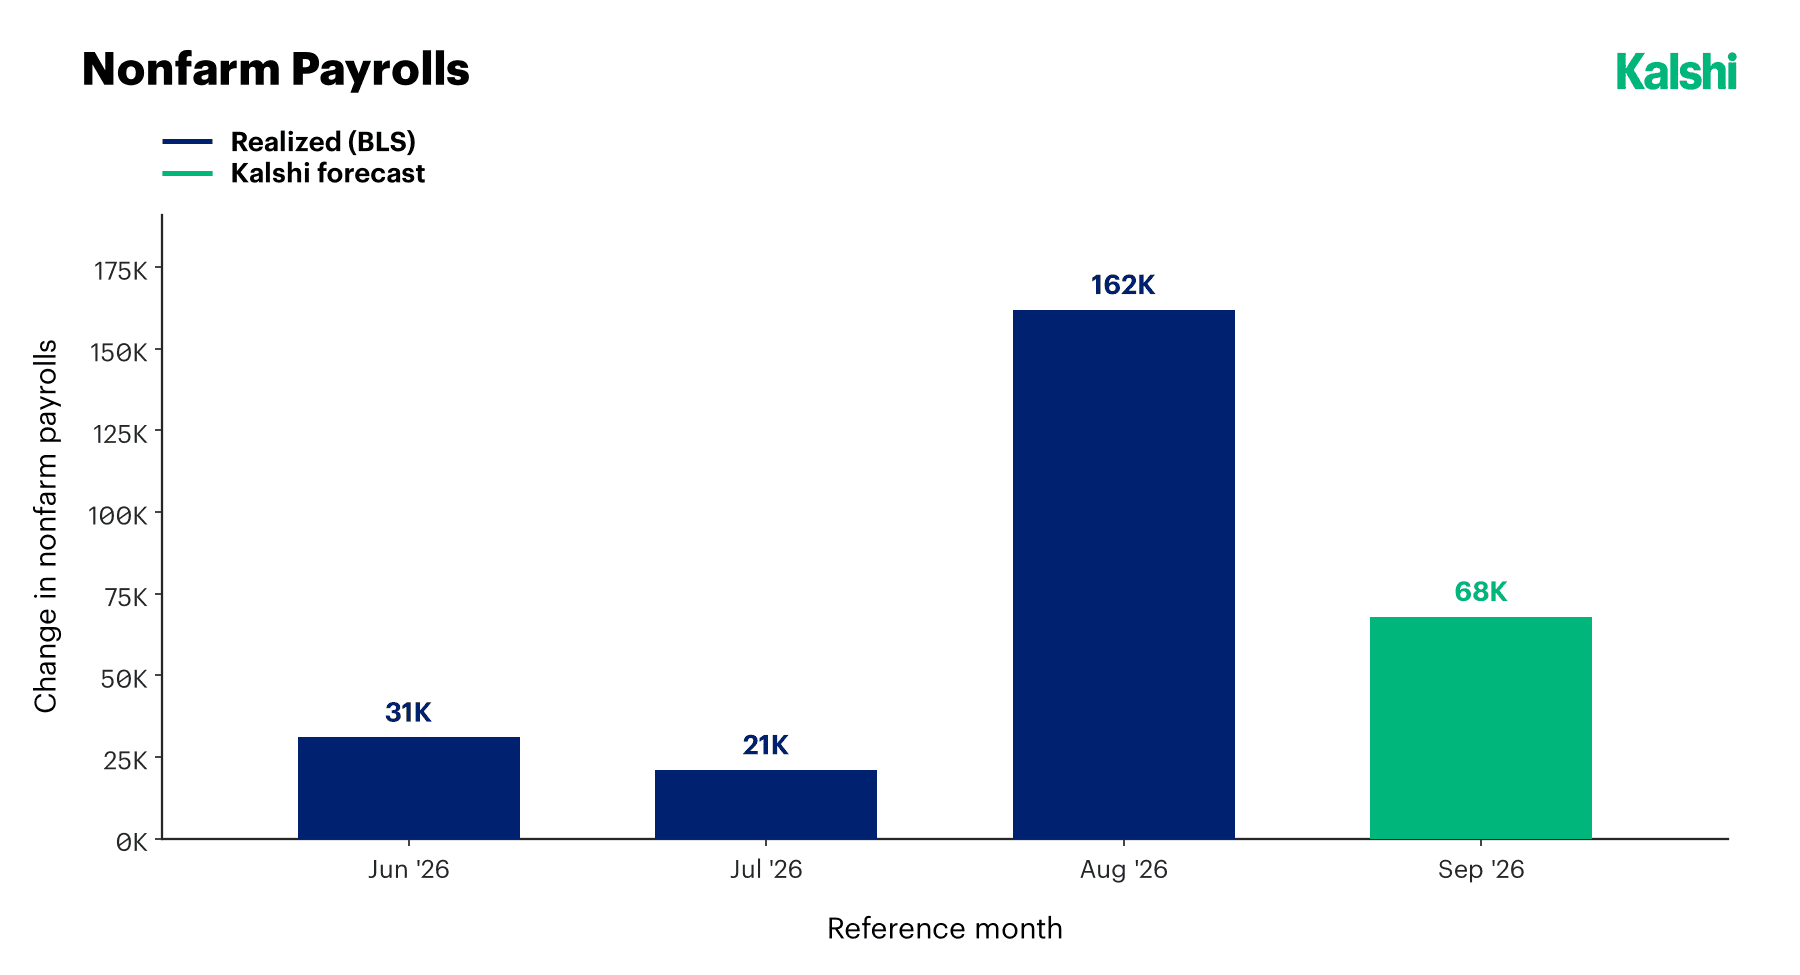
Through the summer the strongest argument for holding was not that inflation was behaving but that employment was not. June and July payrolls came in at +31K and +21K after revisions, against a prior twelve-month average of +31K per month. August broke that: +162,000, roughly three times the +53K consensus, with the unemployment rate unchanged at 4.1%, participation up to 61.6%, and June and July revised up by a combined 55,000. Gains were concentrated in food services and drinking places and in local government education, while information-sector employment fell.
Kalshi prices September payrolls at 68K, well below August and well above the summer trough. The market is reading August as a rebound within a low-hire, low-fire equilibrium rather than a genuine reacceleration in labor demand, which is roughly how Governor Cook has characterized the same data. It matters for inflation in one specific way: average hourly earnings rose 0.3% in August and 3.1% over the year, below the 3.4% headline CPI, and BLS reported real average hourly earnings down 0.2% over the twelve months to July. Whatever is driving this episode, it is not a wage-price spiral. It is a relative-price shock in energy plus a tariff and freight cost layer, arriving in an economy where real pay is falling. What August payrolls removed was the ability to argue that a hike would be tightening into a labor market already rolling over.
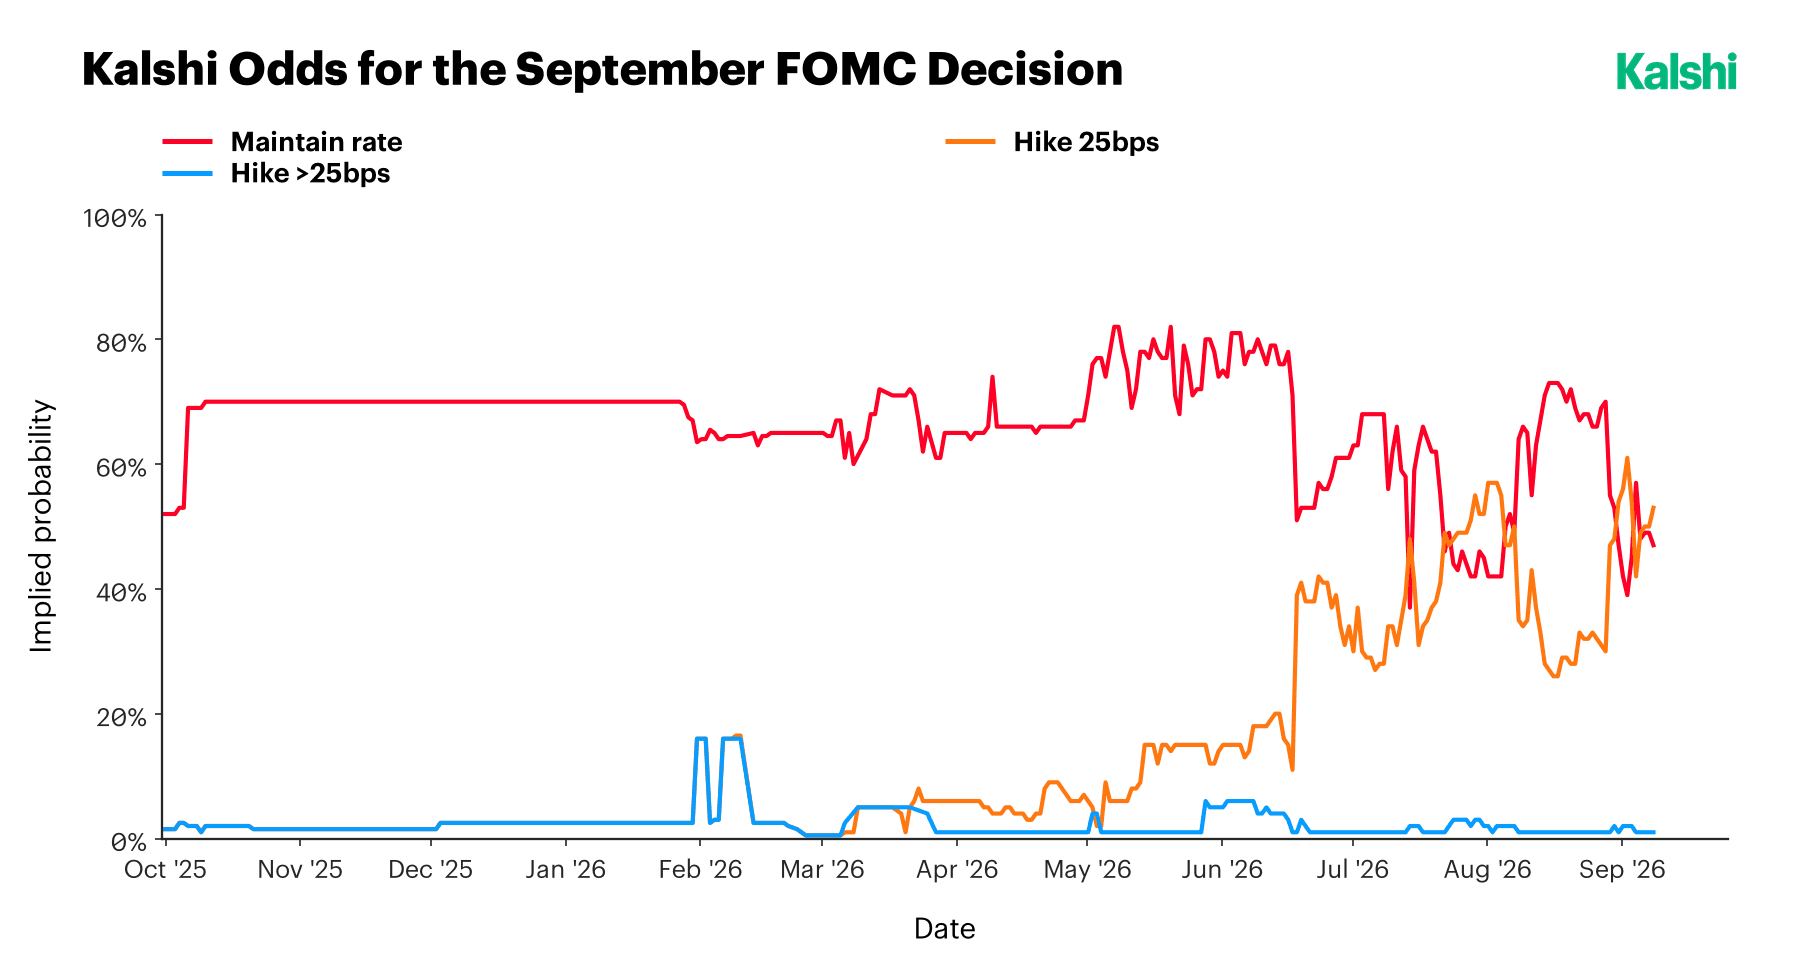
Kalshi’s September FOMC market held a “no change” probability in the 60–80% range for most of the year. That structure broke twice. The first break came in late June, when the hike leg jumped from the low teens to around 40% and the two contracts began trading in a genuinely contested band. The second came on August 28, when Chair Warsh used his first Jackson Hole address to commit explicitly to returning inflation to 2%; the 25bp hike leg was reported at 48% immediately afterward, against a hold probability that had been near 70% beforehand. As of the report date the two legs sit close to even, with maintain around 50% and a 25bp hike in the mid-to-high forties. A move larger than 25bp has been priced at essentially zero all year, aside from a brief spike in February.
The Committee arrives at that decision already divided. July was a 9–3 hold with Cleveland’s Hammack, Minneapolis’s Kashkari and Dallas’s Logan all dissenting in favor of a hike, the most regional-president dissents in one direction since September 2016. September carries a full Summary of Economic Projections, the first chance to move the dot plot against two additional months of inflation and labor data. Under a Chair who has cut the word “inflation” from five mentions per statement to one, more of the reaction function has to be inferred from votes, dots and positioning than from the text, which is exactly the environment continuously repriced markets are built for.
Conclusion
The August print is unlikely to look dramatic. Headline is projected to land somewhere on the 3.3%/3.4% boundary and core at 2.4% or 2.5%, and on any of those combinations the twelve-month rate will have moved less than two tenths in three months. The substance is underneath it. The gasoline base effect that flattered the last two readings has run out, and the contract that priced an 18% year-over-year reading for August a month ago now prices 27.6%. The tariff and freight layer sitting under a 2.5% core implies an underlying trend closer to 1.7–1.8%, with more of that shock still in the pipeline than has landed. And the labor market, which spent the summer supplying the hold case with its best evidence, stopped doing so on September 4.
That combination is why we read the risk around this print as one-sided; moving into a consequential September Fed decision, a surprise to the upside will make a ‘hold’ position shakier.
About Kalshi Research
Signal-rich analysis of prediction markets. Questions, data access (currently free for institutional clients), or collaboration: research@kalshi.com
Disclaimer
This report is published by Kalshi Inc. (“Kalshi,” “we,” or “us”) for informational and educational purposes only. It is not investment, legal, tax, or trading advice, and it does not constitute a recommendation or solicitation to buy, sell, or hold any event contract, security, or other financial instrument. Nothing in this report creates a fiduciary, advisory, or professional-client relationship between Kalshi and the reader.
Kalshi operates a CFTC-regulated exchange. The event contracts and forward curves referenced herein are traded on or derived from Kalshi’s platform. The market prices, forward curves, and implied probabilities cited in this report reflect what market participants thought at a given moment; such data is subject to change without notice. These figures are not guarantees or predictions of actual outcomes. Past and current prices do not indicate future results. Data sourced from third parties is believed to be reliable but has not been independently verified. Third-party projections and estimates cited herein are subject to significant uncertainty and may not be realized.
Trading event contracts carries risk, including the risk that you may lose some or all of your invested capital. Event contract outcomes are binary and can result in the total loss of the amount paid for a contract. Every figure and probability here is current only as of the date of publication. Kalshi undertakes no obligation to update, revise, or correct this report after publication.
Kalshi, its affiliates, officers, directors, and employees may have financial interests in the contracts or markets discussed herein and may trade them at any time without notice to readers.
This report is not directed at any person in any jurisdiction where its distribution or the offering of event contracts would be contrary to local law or regulation. Before acting on anything in this report, consult your own independent legal, tax, financial, or other professional advisor.
This report is not insurance advice and does not constitute a recommendation regarding the purchase, renewal, or cancellation of any insurance policy or program. Comparisons between event contracts and insurance products are illustrative only and do not account for differences in regulatory protections, counterparty credit risk, claims processes, coverage scope, or policyholder rights that may apply to traditional insurance. Readers should consult a licensed insurance professional before making decisions about their insurance or risk-transfer arrangements.
Get new Kalshi Research publications and insights as they are released.