
The Kalshi Citizen Debt Forecast (CDF)
A live framework connecting growth, inflation, and rates to America's fiscal path, as an alternative to the CBO's projections
Published September 3, 2026
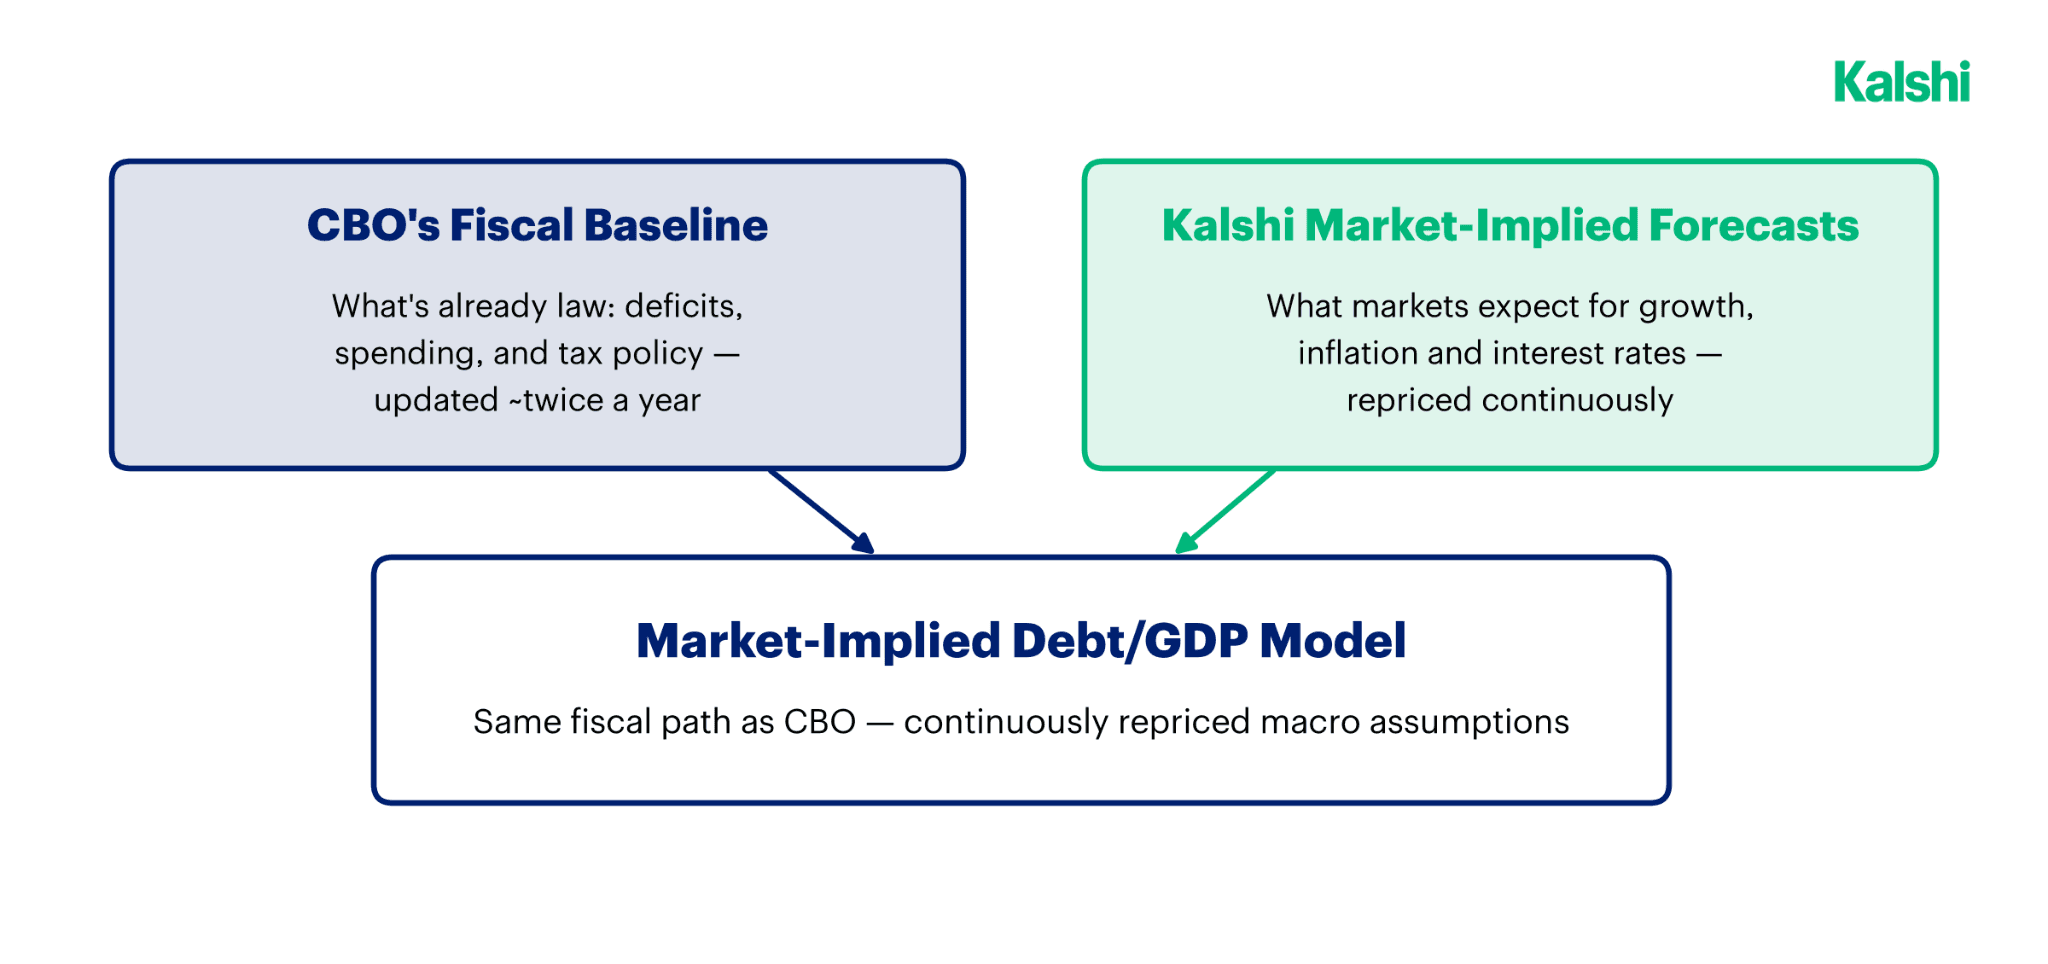
Download PDF- The right comparison is not Kalshi versus CBO. The CDF holds CBO’s fiscal path fixed and layers a continuously repriced macro path on top, so what it isolates is the effect of changing macro assumptions, not a rival tax-and-spending forecast.
- Growth drives the divergence. Market-implied real GDP growth sits above CBO’s long-run projection for much of 2027–2036, and compounded over a decade even modest differences materially change the denominator of Debt/GDP.
- Rates feed through gradually, not at once. Treasury debt rolls over time, so the economically relevant variable is the path of refinancing rates through time rather than today’s policy rate.
- The sensitivities matter more than the point estimate. Under the current calibration a persistent +1pp of real growth improves 2036 Debt/GDP by roughly 10 percentage points, while a persistent +100bp refinancing shock worsens it by roughly 6.
Through our research, we have developed a live framework for connecting growth, inflation and rates to America’s fiscal path, which serves as an alternative to projections made by the Congressional Budget Office (CBO): the Citizen Debt Forecast (CDF).
The U.S. national debt, a combination of public and intra-government debt, just crossed a whopping $40 trillion in the month of August 2026. While eye-popping, simply analyzing debt levels leads to an incomplete understanding of the issue. Debt sustainability is a larger and more complicated relationship between the debt being financed, the economy supporting it, and the interest rate at which that debt is refinanced.
Explained in simple terms, Debt/GDP is a race between a numerator (Debt) and a denominator (GDP). Primary deficits and interest expenses grow the Debt. Real growth and inflation grow the GDP. Interest rates determine how quickly financing costs feed back into the debt stock. Throughout this analysis, “debt” refers to federal debt held by the public, rather than gross federal debt.
Understanding the divergent outcomes that may result from this complex interplay, and the policy consequences required in response, is best done through scenario analysis. Stress testing the fiscal path across outcomes ranging from Goldilocks to stagflation, or testing upside cases like AI-driven productivity shocks, is key to making sound macroeconomic decisions.
The CBO provides the essential baseline for this analysis. Kalshi’s Citizen Debt Forecast and accompanying tool add an advanced layer, one that keeps some key CBO fiscal forecast parameters (such as Deficit to GDP and Other means of financing) fixed, whilst allowing the macroeconomic assumptions to move in real time with Kalshi markets. That turns a static forecast from CBO into a living scenario framework.
New Kalshi Research, straight to your inbox.
The Necessity of Adding Live Markets
CBO is the natural anchor for long-term U.S. fiscal analysis. But a CBO baseline is not designed to be a real-time market forecast.
First, it updates periodically, often twice a year. Market prices can react within minutes to a GDP release, an inflation surprise, a Federal Reserve decision or a change in the economic outlook.
Second, CBO operates under a defined legislative framework. Its baseline generally reflects laws currently on the books; it cannot simply assume that Congress will later raise taxes, cut spending or enact some other policy because an economist thinks that outcome is likely. That discipline is valuable, but it also means the baseline should not be interpreted as a forecast of every future fiscal-policy decision.
This distinction was important in the feedback we received while building the model: the right comparison is not “Kalshi versus CBO.” It is CBO’s fiscal baseline with an alternative, continuously repriced macro path layered on top. Fiscal policy remains an external assumption unless we explicitly shock it in the model.
The market layer therefore answers a targeted and more useful question: if fiscal policy followed the CBO baseline, what debt path would be implied by the growth, inflation and rate environment markets are pricing today? And because those prices change dynamically, the answer should change too.
The Model Mechanics
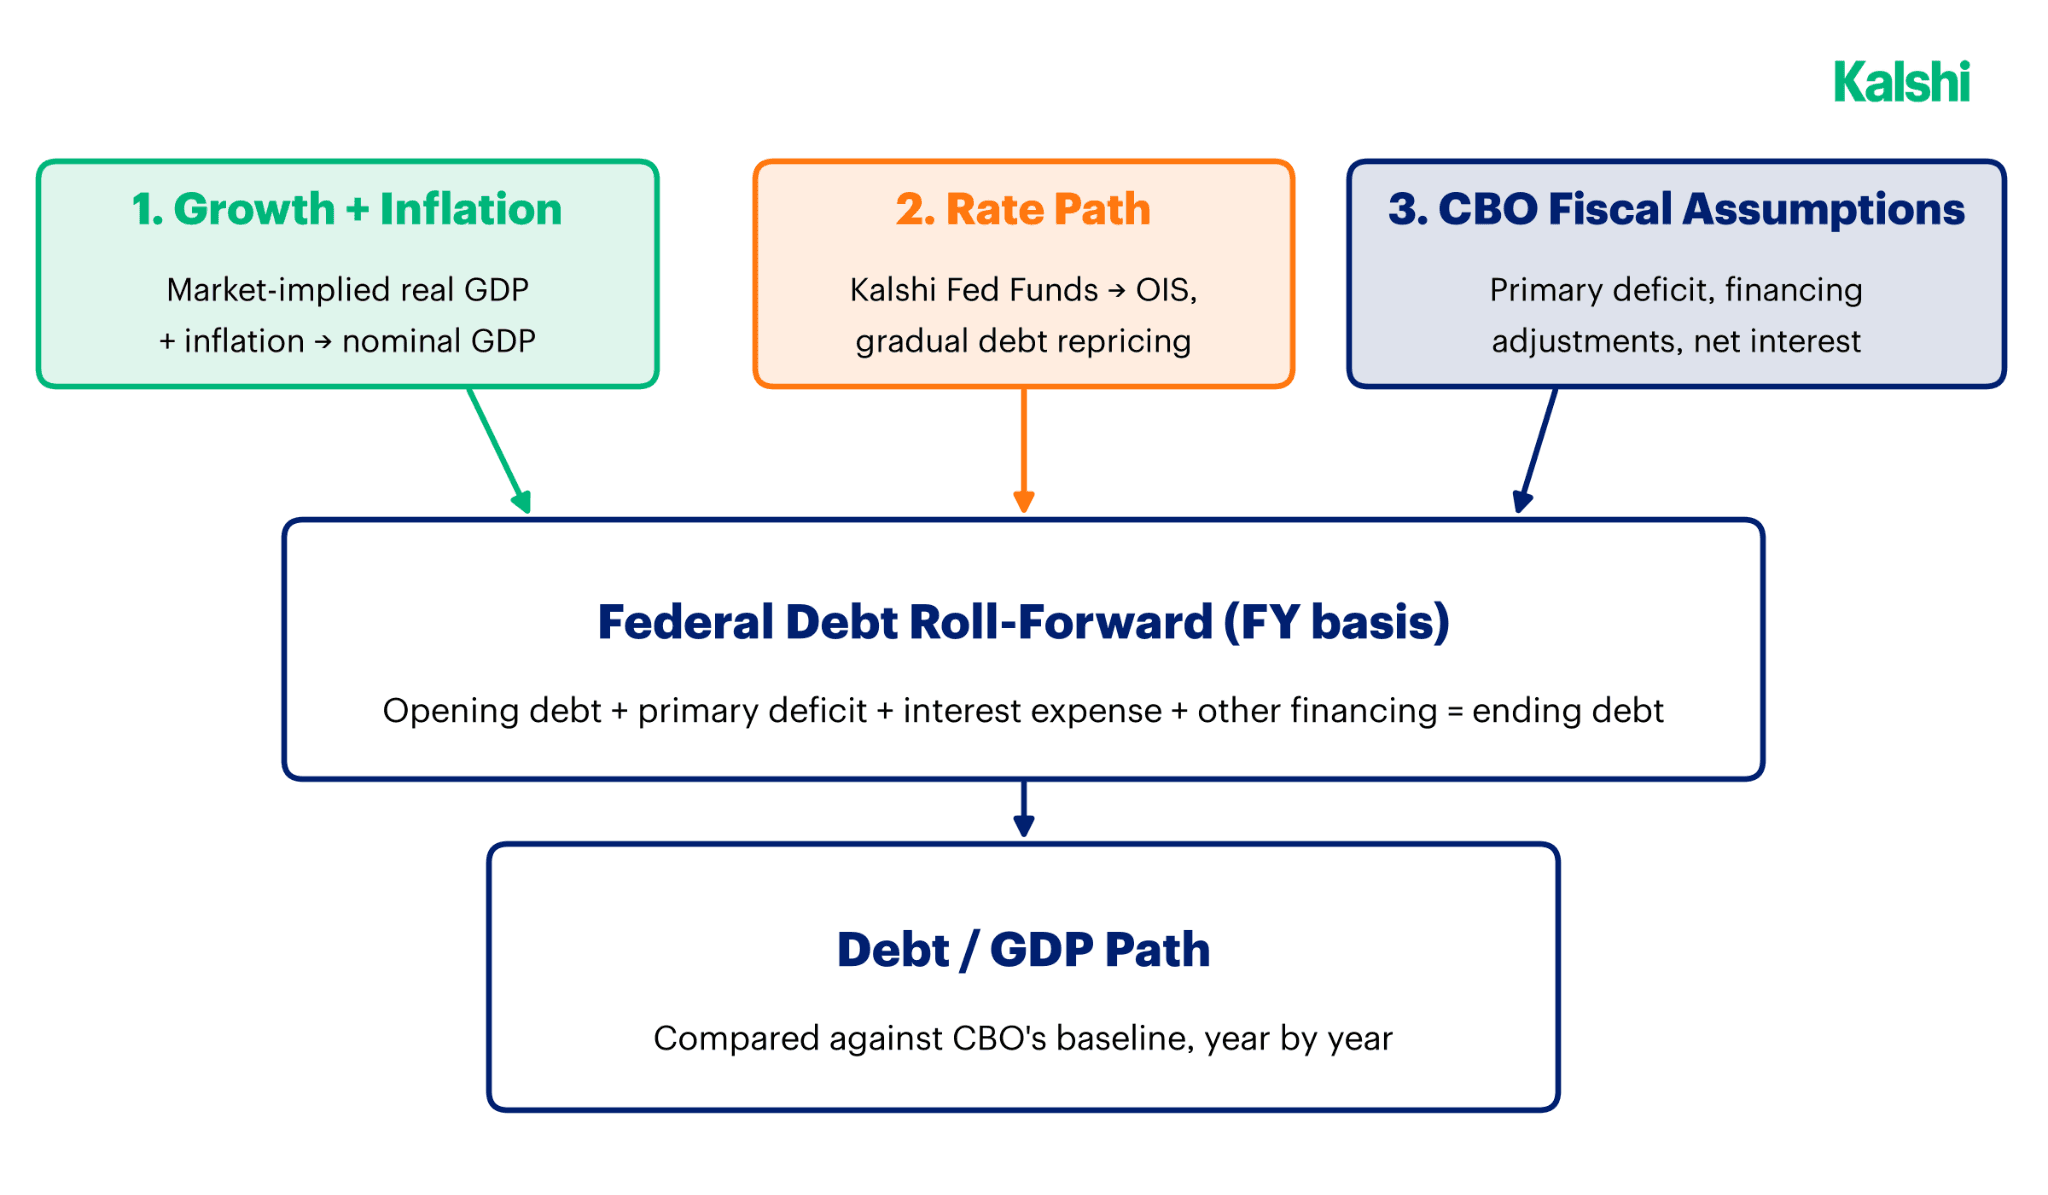
The model links three macro variables to the federal balance sheet.
- Growth and inflation determine nominal GDP. Market-implied real GDP growth is combined with an inflation assumption to estimate the nominal size of the economy. The model explicitly bridges calendar-year macro data into the federal fiscal year rather than mixing the two conventions.
- The interest rate path determines refinancing costs. The model does not assume that the entire federal debt stock instantly reprices when rates move. Existing debt rolls gradually, so the effective interest rate changes over time as Treasury securities mature or reset. Near-term rates are anchored to dated Kalshi Federal Reserve markets, with the curve transitioning to Fed Funds OIS further out.
- CBO fiscal assumptions determine new borrowing. Primary deficits remain anchored to the CBO framework, allowing us to isolate the effect of changing macro assumptions rather than mixing a new economic forecast with an entirely different tax-and-spending forecast.
The result is best thought of as a conditional forecast: given a fiscal path, what do current market-implied macro conditions do to Debt/GDP?
The Relationship Between the Market-Implied Path and CBO
Before trusting any divergence between the two paths, it’s worth checking that the model is internally sound – that it reproduces CBO’s own baseline when nothing has genuinely diverged yet, and only drifts where the underlying assumptions actually differ.
As a consistency check, the market-implied path tracks CBO’s baseline closely in the early years and diverges only as the underlying macro assumptions begin to separate. The size of that divergence will vary as market prices and model inputs change, so the important signal is not a fixed end-point gap but where the two frameworks differ and why.
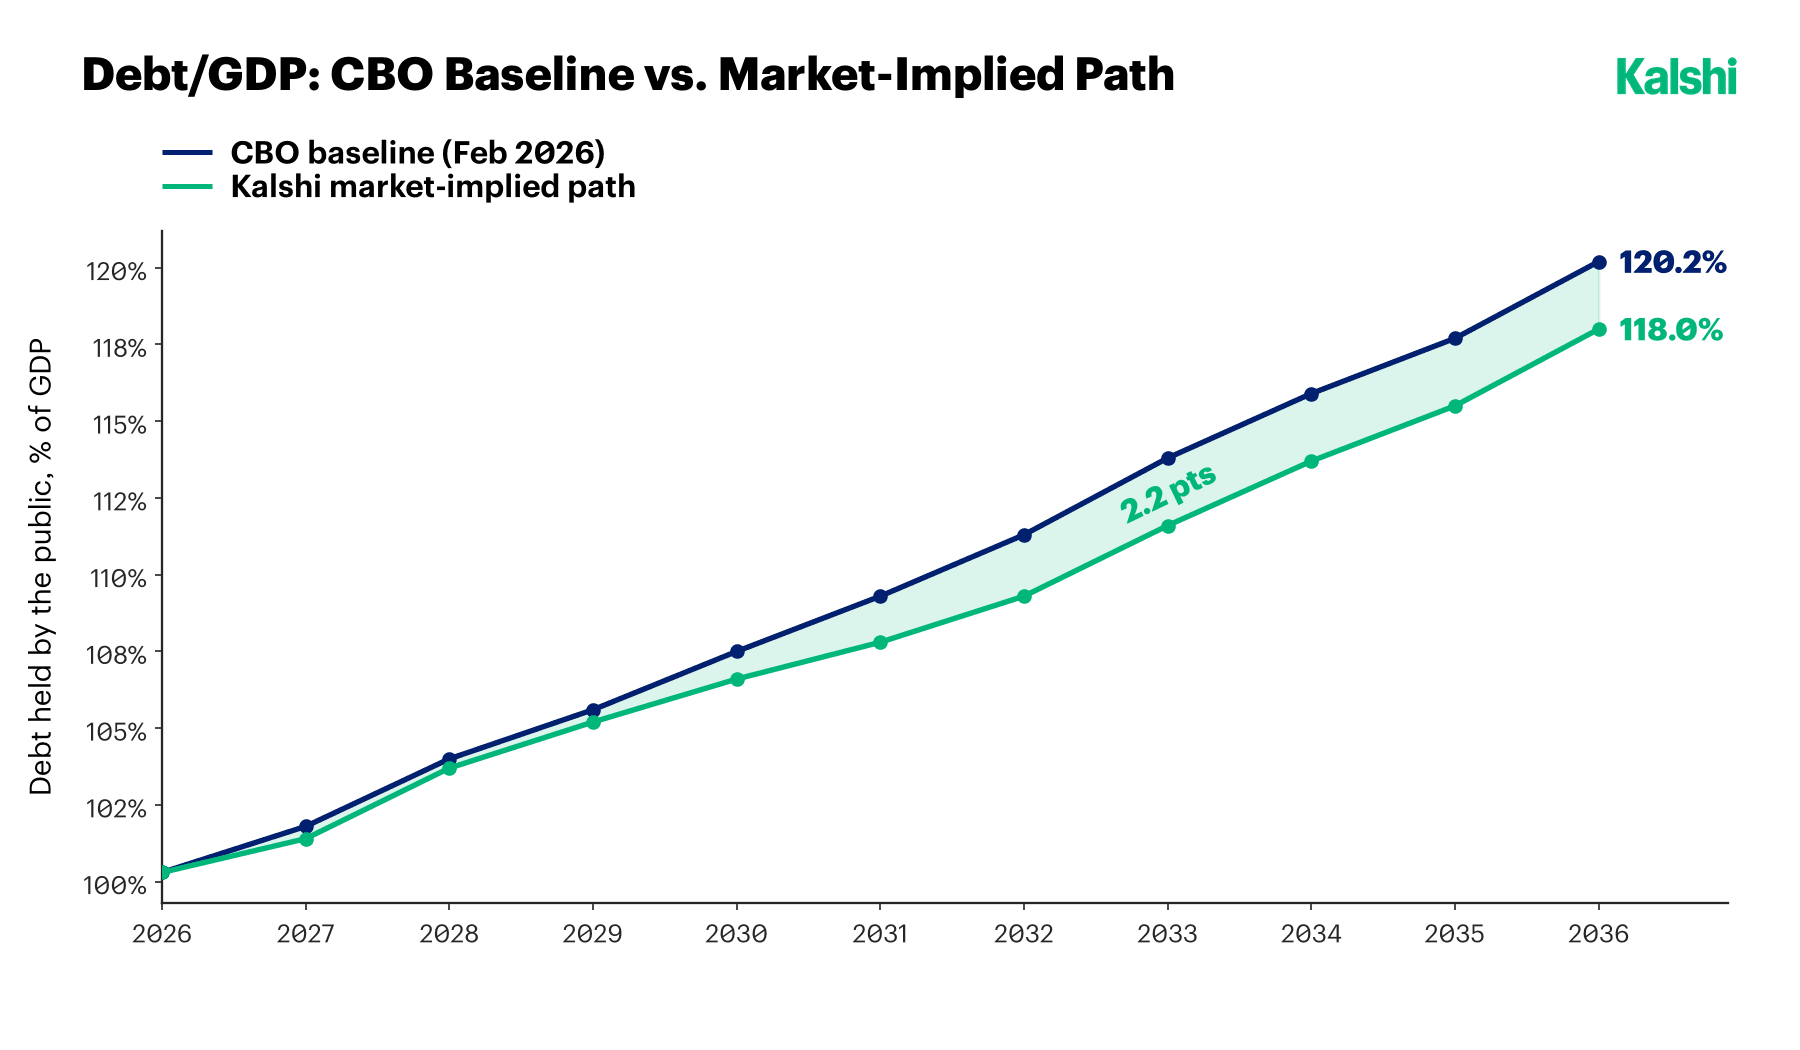
The divergence appears to be driven primarily by different growth assumptions. From observing Kalshi’s markets for much of 2027–2036, market-implied real GDP growth is above CBO’s long-run projection. Compounded over a decade, even modest differences in growth can materially change the denominator of Debt/GDP. Other modelling assumptions – including inflation, refinancing costs and the pace at which Treasury debt re-prices – also affect the path, which is why the absolute forecast should be interpreted as conditional rather than precise.
Scenario Analysis: The Importance of Sensitivity Testing
It is tempting to focus on a single forecast of a ten-year Debt/GDP number. We think that doing so would be a disservice to the full power of the tool, which is designed to provide the ability to conduct scenario analyses that grant a richer and more holistic view into the fiscal outlook.
The market inputs will move. And some parts of the model necessarily require assumptions: headline CPI must be translated into a GDP-deflator framework; Treasury refinancing costs require a financing-spread assumption over the long-term fed-fund forecasts; and the debt-repricing schedule uses Treasury maturity information as a proxy for how quickly the debt stock refinances.
For that reason, the more durable insight is how the fiscal path responds when the macro environment changes.
Under the model’s current calibration, for example:
- A persistent +1 percentage point of real GDP growth improves 2036 Debt/GDP by roughly 10 percentage points relative to the base case.
- A persistent +100bp refinancing-rate shock worsens it by roughly 6 percentage points.
- A combined stronger-growth/lower-rate environment produces a dramatically better trajectory, while a stagflationary combination of weak real growth and higher financing costs produces a much worse one.
- Innovations such as AI may have a profound impact on productivity growth and are critical to depict; the tool therefore lets users update the key model parameters and see the impact of such changes.
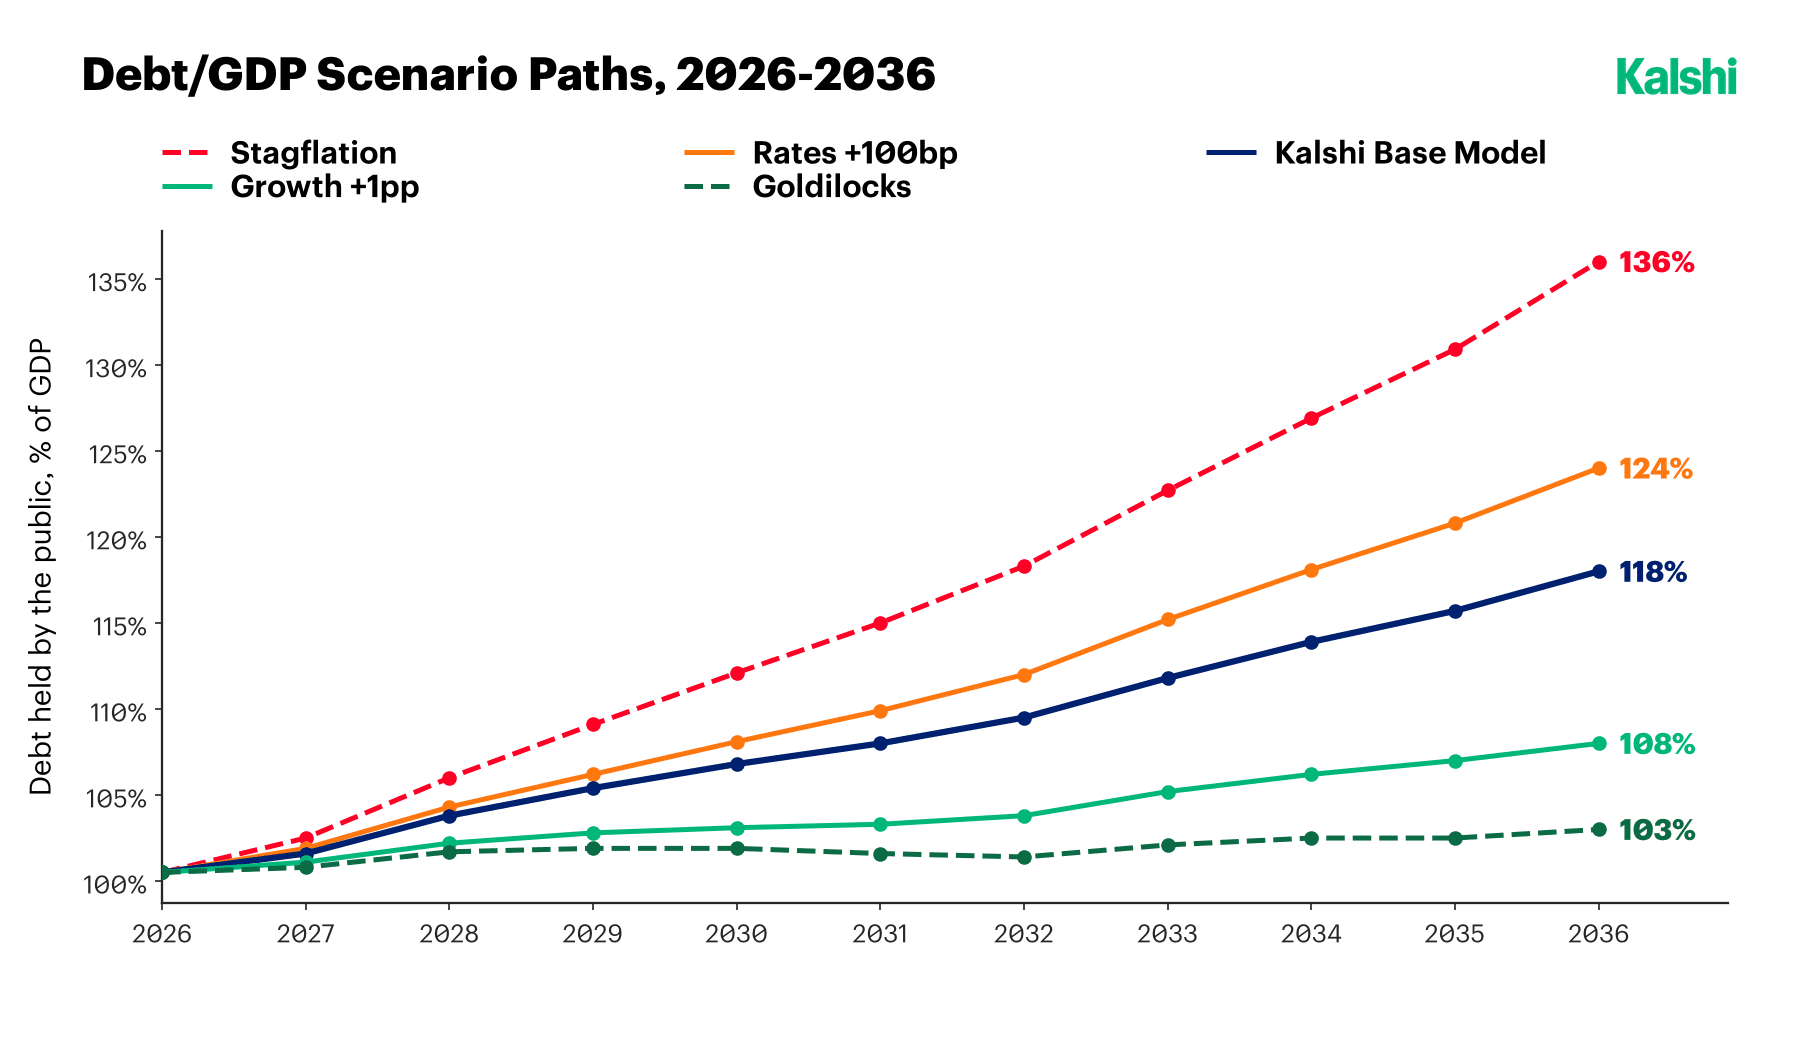
These are illustrative sensitivities, not predictions. Their value is in showing the compounding mechanism: growth and inflation matter because they expand the denominator every year; rates matter because refinancing occurs repeatedly across a very large debt stock and is increasingly becoming a key component of the debt. And the three interact: a modest annual difference, sustained for a decade, can materially change the fiscal picture.
The Importance of the Interest Rate Path
Another point raised in our survey of economists was that federal interest costs cannot be modelled with a single Fed Funds assumption.
The Treasury has debt outstanding across many maturities. A rate move today therefore affects the government gradually as old debt is refinanced. That means the economically relevant variable is not simply today’s policy rate, but the path of refinancing rates through time.
This is where market curves are especially useful. They let the model update not only when the expected level of rates changes, but also when the shape and timing of the expected rate path changes. The same principle applies to growth: near-term realized data can be blended into the forecast as it arrives, while market expectations drive the remaining horizon.
A Modelling Tool, Not a Single Answer
The purpose of the model is not to claim that a market-implied debt forecast is more “correct” than CBO. It is to make the fiscal outlook dynamic, and to say precisely where and why markets and CBO disagree when they do.
As growth expectations change, the GDP (denominator) changes. As rate expectations change, the interest burden changes. If Congress changes fiscal policy, the fiscal assumptions can change too. That allows the tool to answer questions that a static baseline cannot answer on its own:
- How much real growth would be needed to stabilize Debt/GDP?
- What happens if refinancing rates stay 100bp higher for several years?
- How much does a productivity-driven growth shock improve the fiscal path?
- What combination of weaker growth and higher rates creates the greatest pressure?
The output should therefore be read as a live market overlay on a CBO fiscal baseline, not as a fixed ten-year prediction. CBO gives us the disciplined fiscal starting point. Markets give us continuously changing information about the macro environment around it. Putting the two together creates a framework that can update whenever the economic outlook does – and that can show its work when the two views part ways.
Methodology disclaimers
The model is an analytical scenario framework, not an official CBO projection or investment recommendation. Market prices can reflect liquidity, positioning and risk premia as well as expectations. Results also depend on modelling assumptions including inflation-to-GDP-deflator conversion, Treasury refinancing spreads, and the rate at which outstanding debt reprices. The absolute Debt/GDP path should therefore be interpreted with appropriate uncertainty; the model is particularly useful for comparing scenarios and sensitivities through time.
About Kalshi Research
Signal-rich analysis of prediction markets. Questions, data access (currently free for institutional clients), or collaboration: research@kalshi.com
Reference Material
- Congressional Budget Office. "The Budget and Economic Outlook: 2026 to 2036." Publication 62105, February 2026. The fiscal baseline the model holds fixed: primary deficits, other means of financing, nominal GDP and the debt held by the public. https://www.cbo.gov/publication/62105
- Congressional Budget Office. "The Long-Term Budget Outlook," 2026 extended baseline. Used for the illustrative 2037-2045 extension of the fiscal-risk view.
- U.S. Department of the Treasury. "Debt to the Penny." Fiscal Data. The daily official figure behind the live debt tracker. https://fiscaldata.treasury.gov/datasets/debt-to-the-penny/debt-to-the-penny
- Kalshi market data. Market-implied real GDP growth (KXGDPYEAR), headline inflation (KXUSCPIYEAR) and the fed funds path (KXFEDDECISION, KXFEDFUNDSYEAR), with the long-end rate curve from fed funds OIS.
Disclaimer
This report is published by Kalshi Inc. (“Kalshi,” “we,” or “us”) for informational and educational purposes only. It is not investment, legal, tax, or trading advice, and it does not constitute a recommendation or solicitation to buy, sell, or hold any event contract, security, or other financial instrument. Nothing in this report creates a fiduciary, advisory, or professional-client relationship between Kalshi and the reader.
Kalshi operates a CFTC-regulated exchange. The event contracts and forward curves referenced herein are traded on or derived from Kalshi’s platform. The market prices, forward curves, and implied probabilities cited in this report reflect what market participants thought at a given moment; such data is subject to change without notice. These figures are not guarantees or predictions of actual outcomes. Past and current prices do not indicate future results. Data sourced from third parties is believed to be reliable but has not been independently verified. Third-party projections and estimates cited herein are subject to significant uncertainty and may not be realized.
Trading event contracts carries risk, including the risk that you may lose some or all of your invested capital. Event contract outcomes are binary and can result in the total loss of the amount paid for a contract. Every figure and probability here is current only as of the date of publication. Kalshi undertakes no obligation to update, revise, or correct this report after publication.
Kalshi, its affiliates, officers, directors, and employees may have financial interests in the contracts or markets discussed herein and may trade them at any time without notice to readers.
This report is not directed at any person in any jurisdiction where its distribution or the offering of event contracts would be contrary to local law or regulation. Before acting on anything in this report, consult your own independent legal, tax, financial, or other professional advisor.
This report is not insurance advice and does not constitute a recommendation regarding the purchase, renewal, or cancellation of any insurance policy or program. Comparisons between event contracts and insurance products are illustrative only and do not account for differences in regulatory protections, counterparty credit risk, claims processes, coverage scope, or policyholder rights that may apply to traditional insurance. Readers should consult a licensed insurance professional before making decisions about their insurance or risk-transfer arrangements.
Get new Kalshi Research publications and insights as they are released.