
Weathering The Storm: Hedging Climate Risk
Published August 31, 2026
Download PDF- A steadily rising bill. U.S. weather and climate disasters have trended from roughly $30–50 billion in annual damage in the early 2000s to well over $150 billion in recent years, with 2026 on pace to land in that upper range; the increase reflects both more frequent severe events and more value concentrated in exposed areas.
- Calibration at scale is the basis for genuine price discovery. Across roughly 70,000 to 73,000 resolved daily weather markets per horizon, prices track realized outcomes closely at every stage tested, a 70-cent contract resolves “yes” close to 70% of the time. That consistency, sustained across tens of thousands of observations, is what distinguishes a continuously repriced market signal from a static point estimate, and it is the basis on which these prices can be used for hedging or reference purposes with confidence.
- The hedging use case is real and structurally underused. Exchange-traded, city/day-level contracts with low minimum size open weather hedging to businesses that the traditional OTC market, built for large, sophisticated counterparties, was never designed to serve. Small businesses are paying attention.
What Climate Markets Address
Weather is a recurring, well-documented source of economic variability. Academic estimates cited in industry literature associate a one standard-deviation increase in rainfall with roughly a 0.17% reduction in local income, a cool summer with a 0.25% reduction, and a cold winter with a 0.1% reduction. More severe events, such as droughts, have been associated with GDP declines of up to 2% in affected regions. Cumulative losses from weather-related extreme events over the past decade have been estimated near $2 trillion, with some projections placing future losses in the tens of trillions of dollars over coming decades. These are third-party estimates that depend heavily on assumptions about emissions paths, adaptation, and measurement methodology, and should be read as indicative orders of magnitude rather than precise figures.
For context, traditional weather derivatives have existed in over-the-counter form since the late 1990s and have been estimated at roughly $25 billion in annual notional volume, though as an unregulated, bilaterally negotiated market, comprehensive volume data are not publicly reported and this figure should be treated as approximate. The main structural differences between that legacy market and exchange-listed contracts are standardization, continuous public price discovery, and the availability of historical pricing data, rather than necessarily the type of risk being transferred.
Markets Available on Kalshi
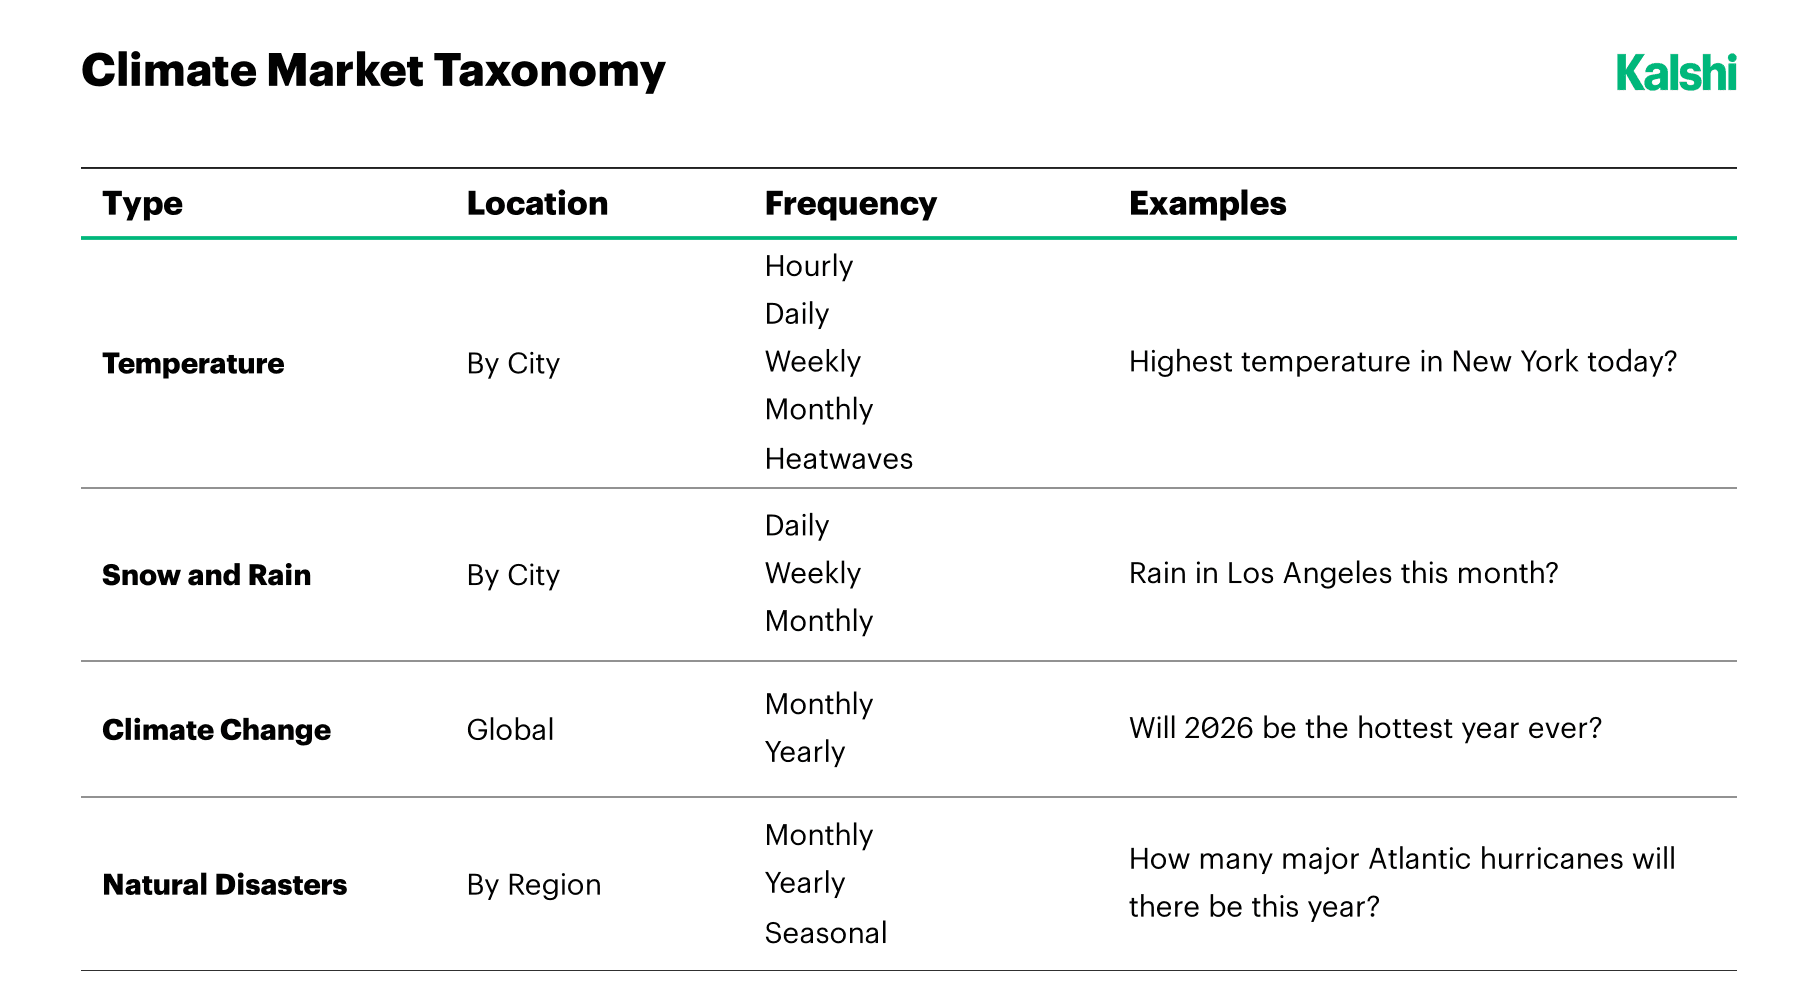
Contracts are organized around four broad categories, summarized in the table below: temperature and precipitation markets by city across a range of frequencies from hourly to seasonal; longer-dated global markets tied to climate benchmarks; and regional markets on natural disaster counts such as hurricanes.
Forecast Accuracy: Climate Markets
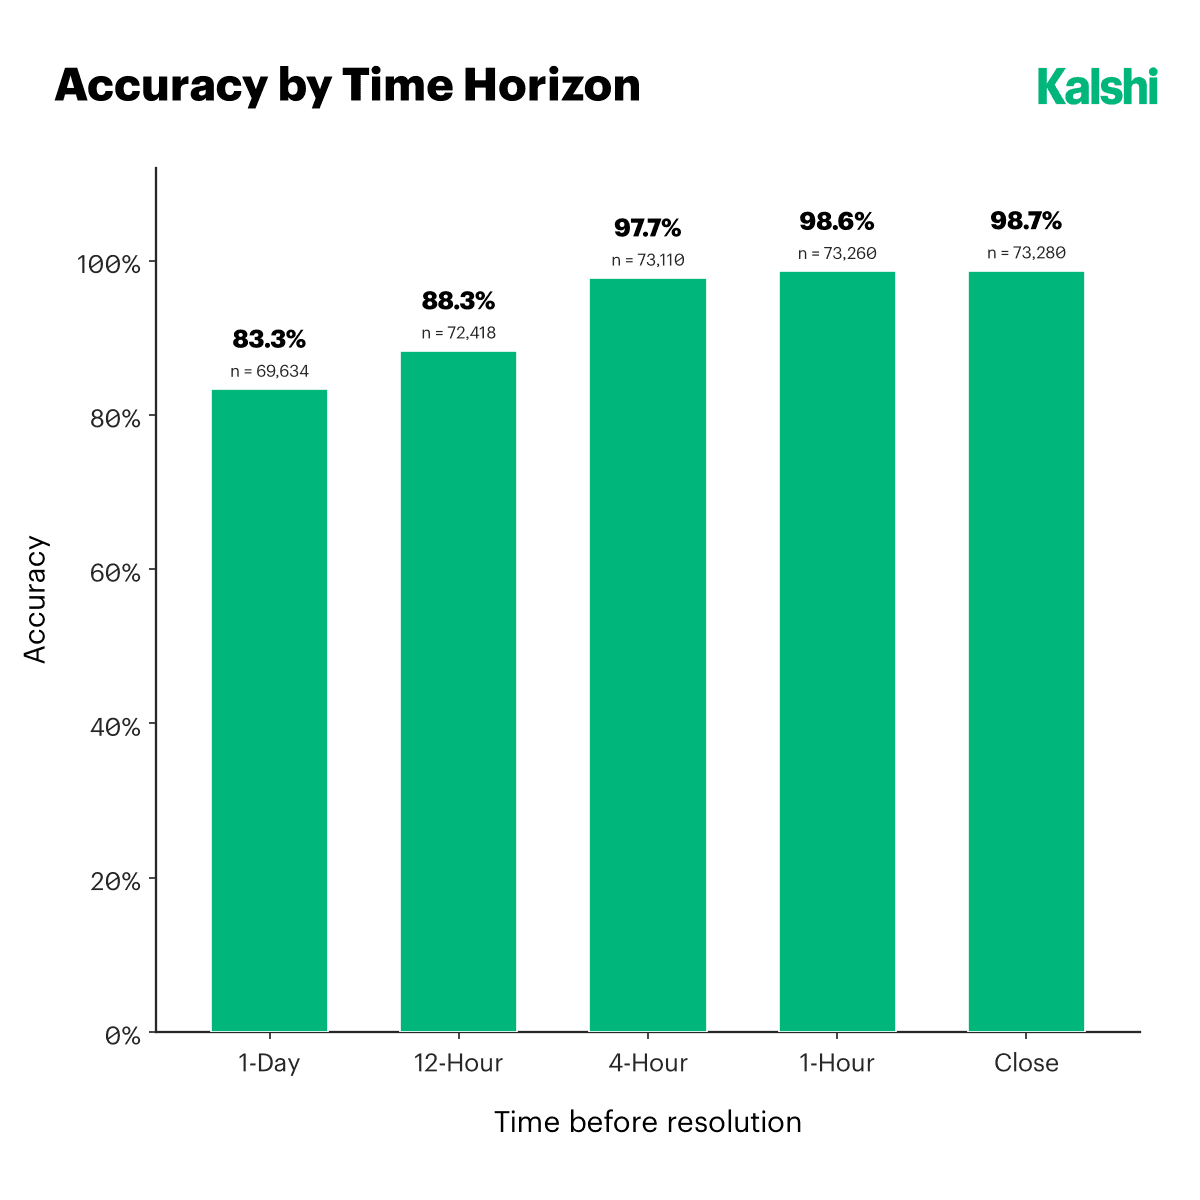
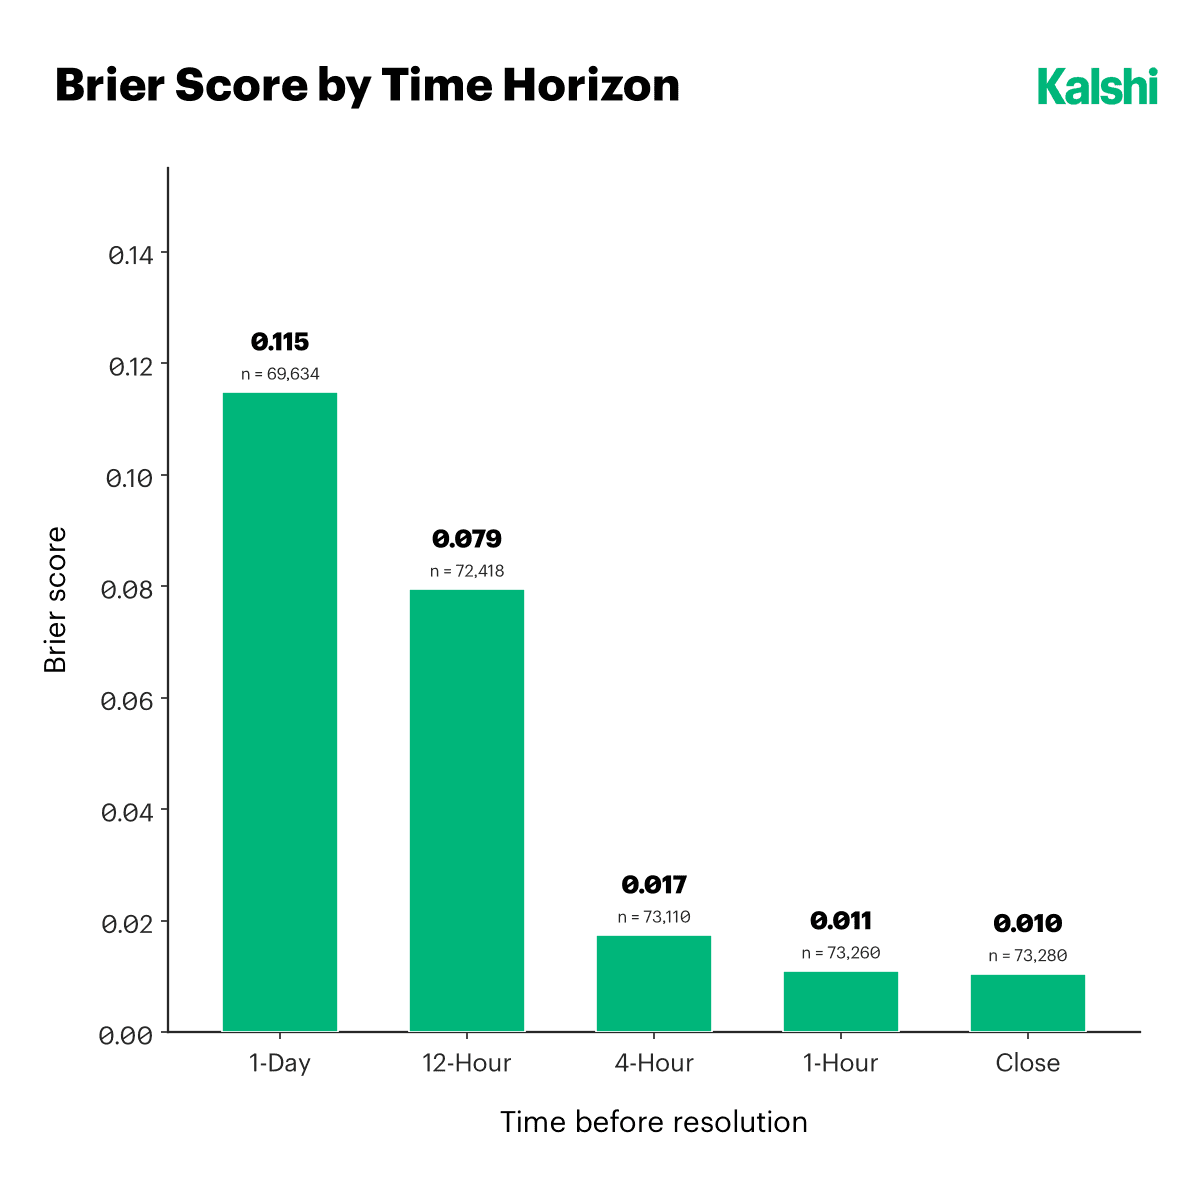
Kalshi has published accuracy and Brier score statistics for its daily weather markets (largely temperature and precipitation contracts) across a sample of roughly 69,600 to 73,300 resolved markets at each of five horizons before resolution. Accuracy, defined here as the share of markets in which the higher-priced outcome ultimately occurred, rises from 83.3% one day ahead to 88.3% at twelve hours, 97.7% at four hours, 98.6% at one hour, and 98.7% at close. The Brier score, which combines calibration and sharpness into a single measure where lower values are better, falls over the same horizons from 0.115 to 0.010.
New Kalshi Research, straight to your inbox.
Calibration: Daily Weather Markets
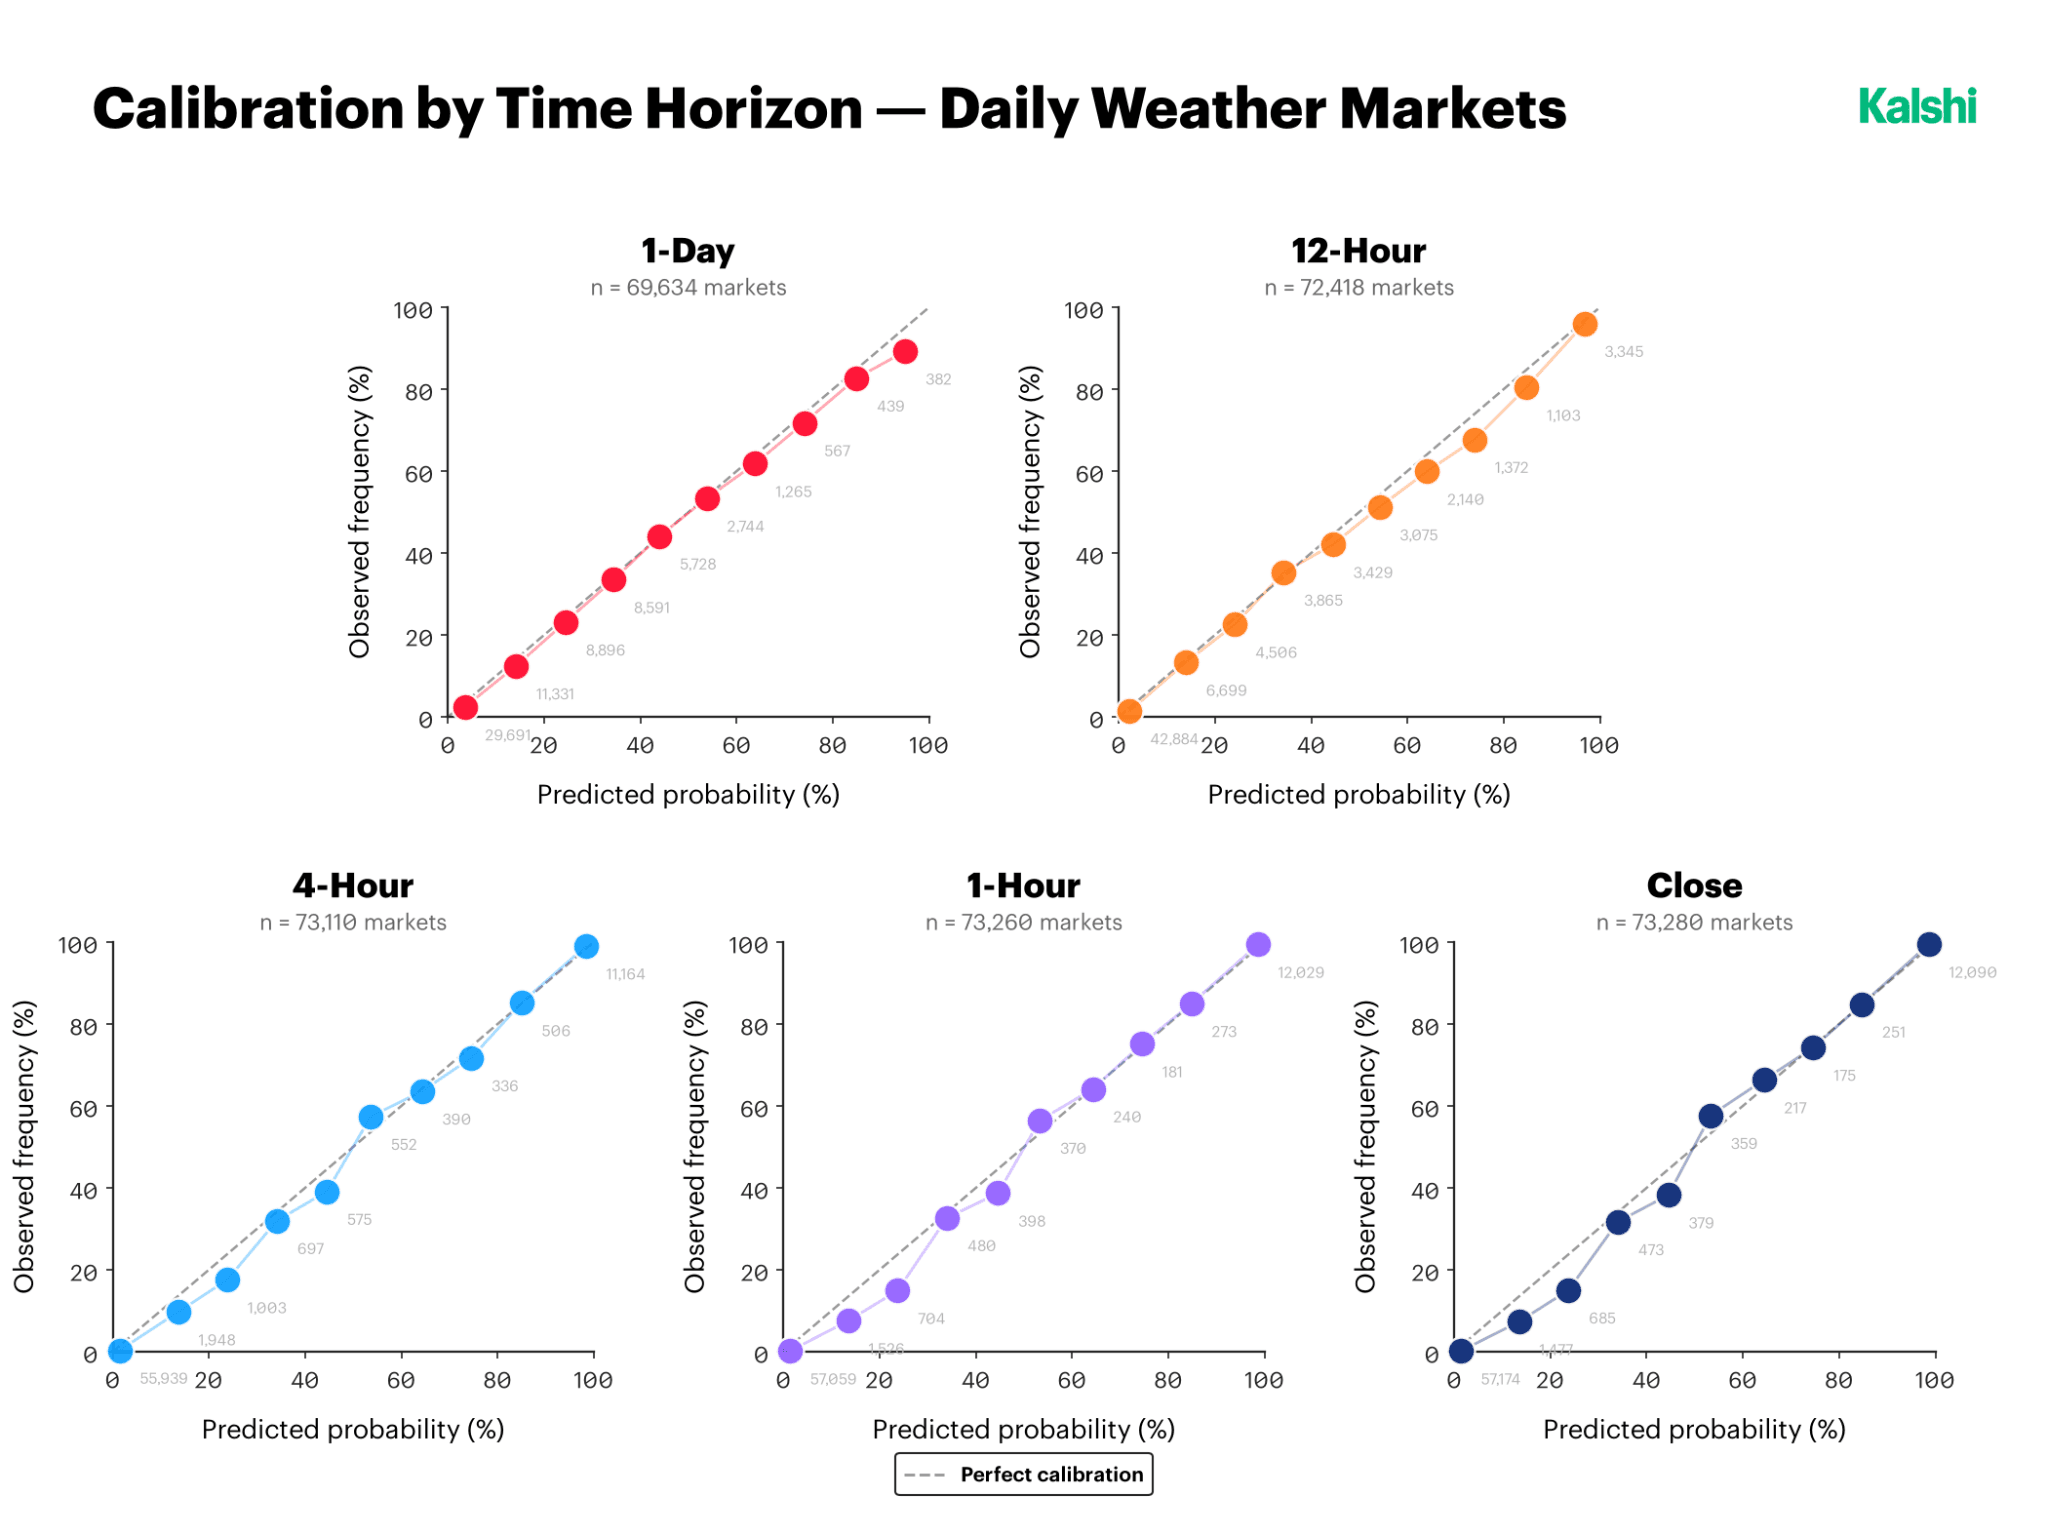
Calibration compares stated probabilities against observed outcome frequencies: a market pricing an event at 70% should see that event occur close to 70% of the time it is priced that way. Across all five horizons tested, the daily weather markets track the line of perfect calibration closely, with only modest divergence at the extreme ends of the probability range, where the underlying bucket sample sizes are thinner (as indicated by the smaller counts labeled near each point). This pattern is broadly consistent with well-functioning markets, though it is also unsurprising given the very large sample sizes involved: each horizon reflects between roughly 70,000 and 73,000 resolved markets.
Forecast Accuracy and Calibration: Longer-Horizon Climate Markets
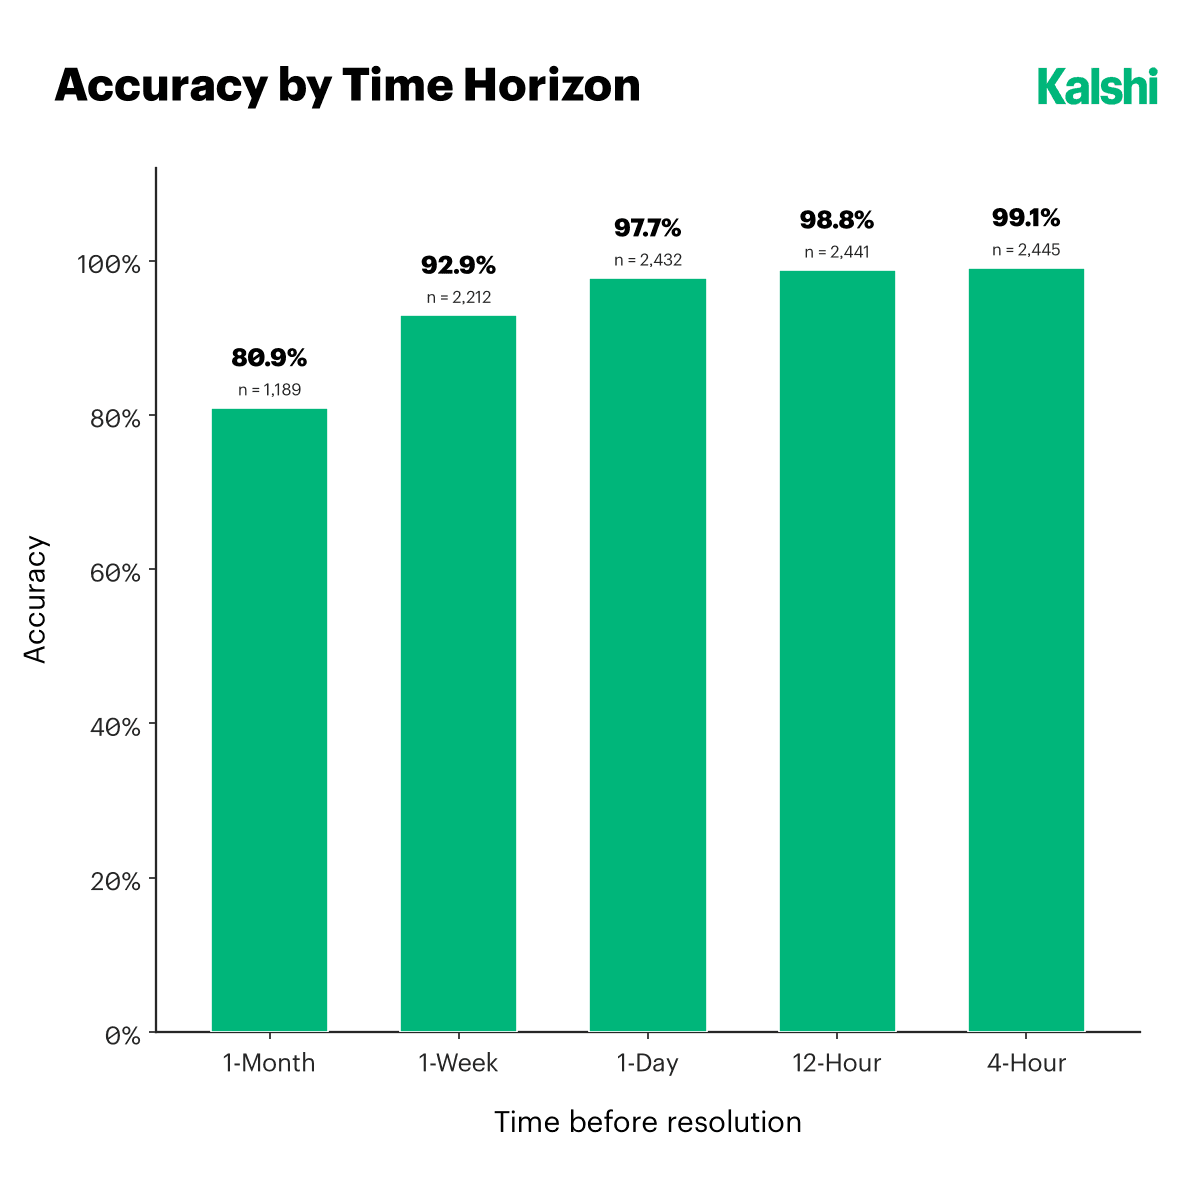
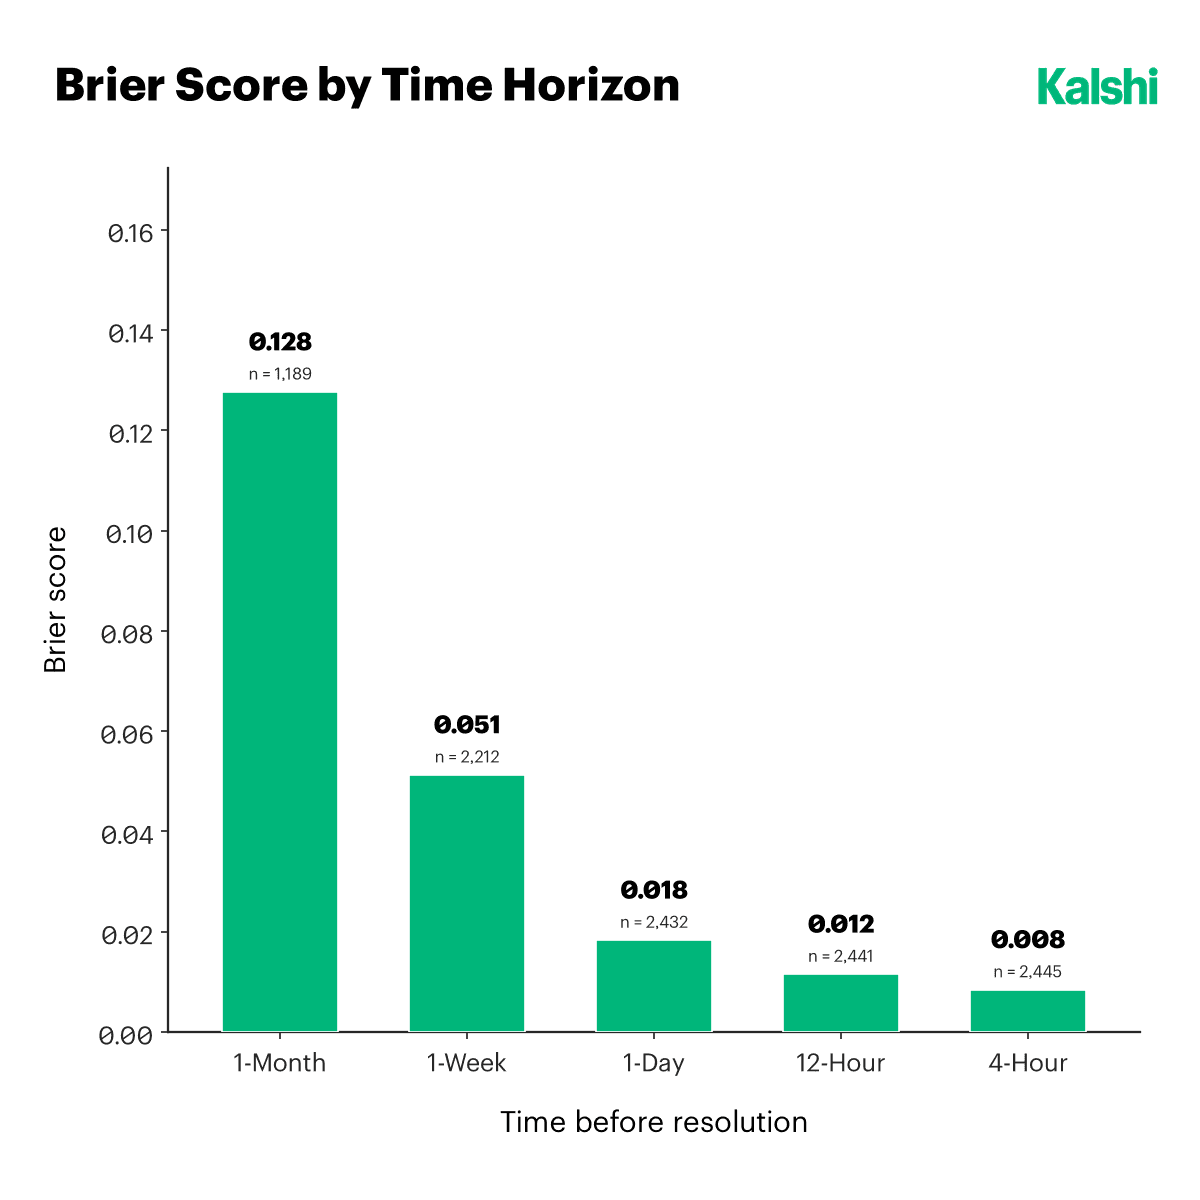
Kalshi separately reports accuracy and Brier score statistics for climate markets outside the daily weather category (weekly, monthly, and seasonal contracts on precipitation, snowfall, and related targets). Accuracy ranges from 80.9% at the one-month horizon to 99.1% at four hours before close, with the Brier score falling from 0.128 to 0.008 over the same range.
Climate Change Indicators
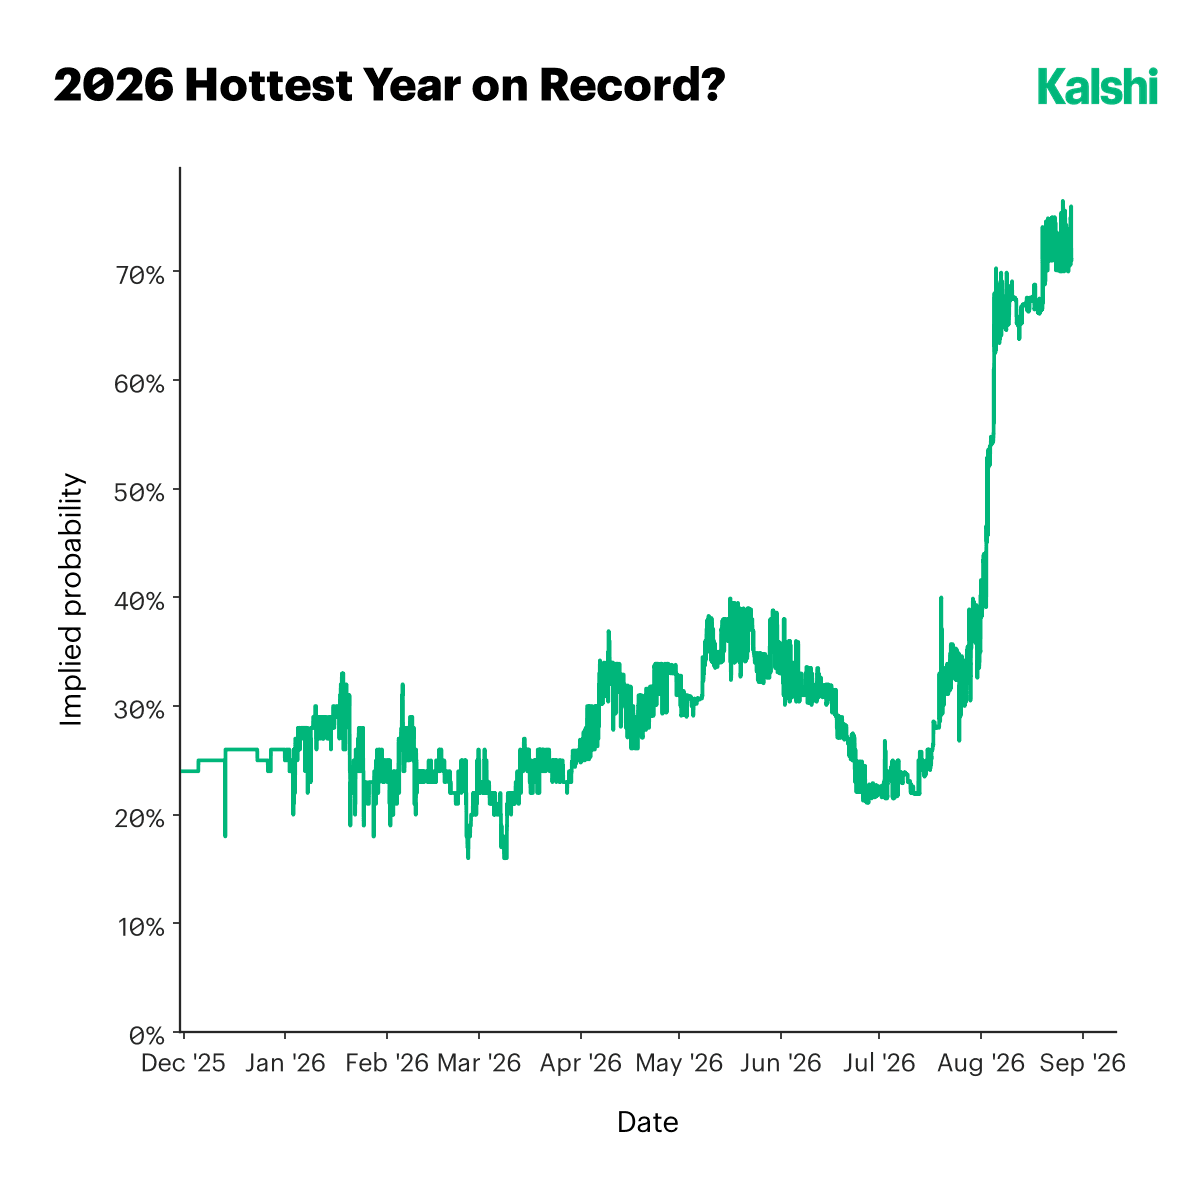
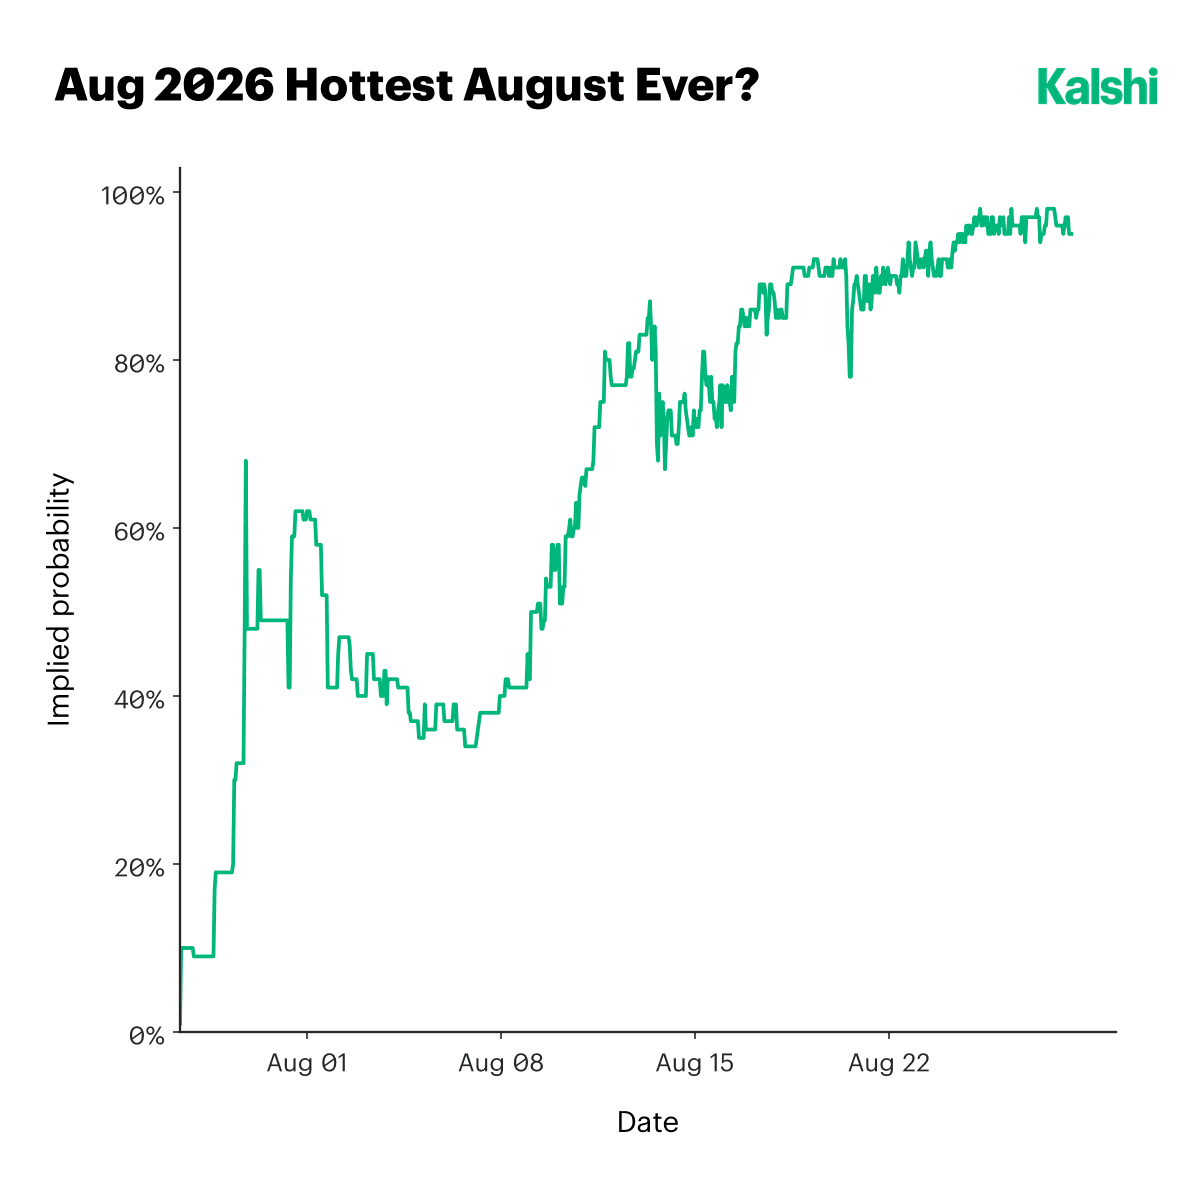
Kalshi also lists longer-dated contracts that provide a market-based readout on climate trajectories and policy outcomes. As of late August 2026, the implied probability that 2026 will be the hottest year on record stood near 75%, up from roughly 25% at the start of the year. Most of that increase occurred as a step change in July, coinciding with widely reported record-breaking heat in July and August of this year. A separate contract on whether August 2026 will be the hottest August on record moved from roughly 40% in early August to near 97% by month end, tracking realized temperature reporting over the course of the month. This pattern, prices moving in response to information becoming available as the underlying event unfolds, is consistent with normal market repricing rather than a forecast made substantially in advance of the outcome.
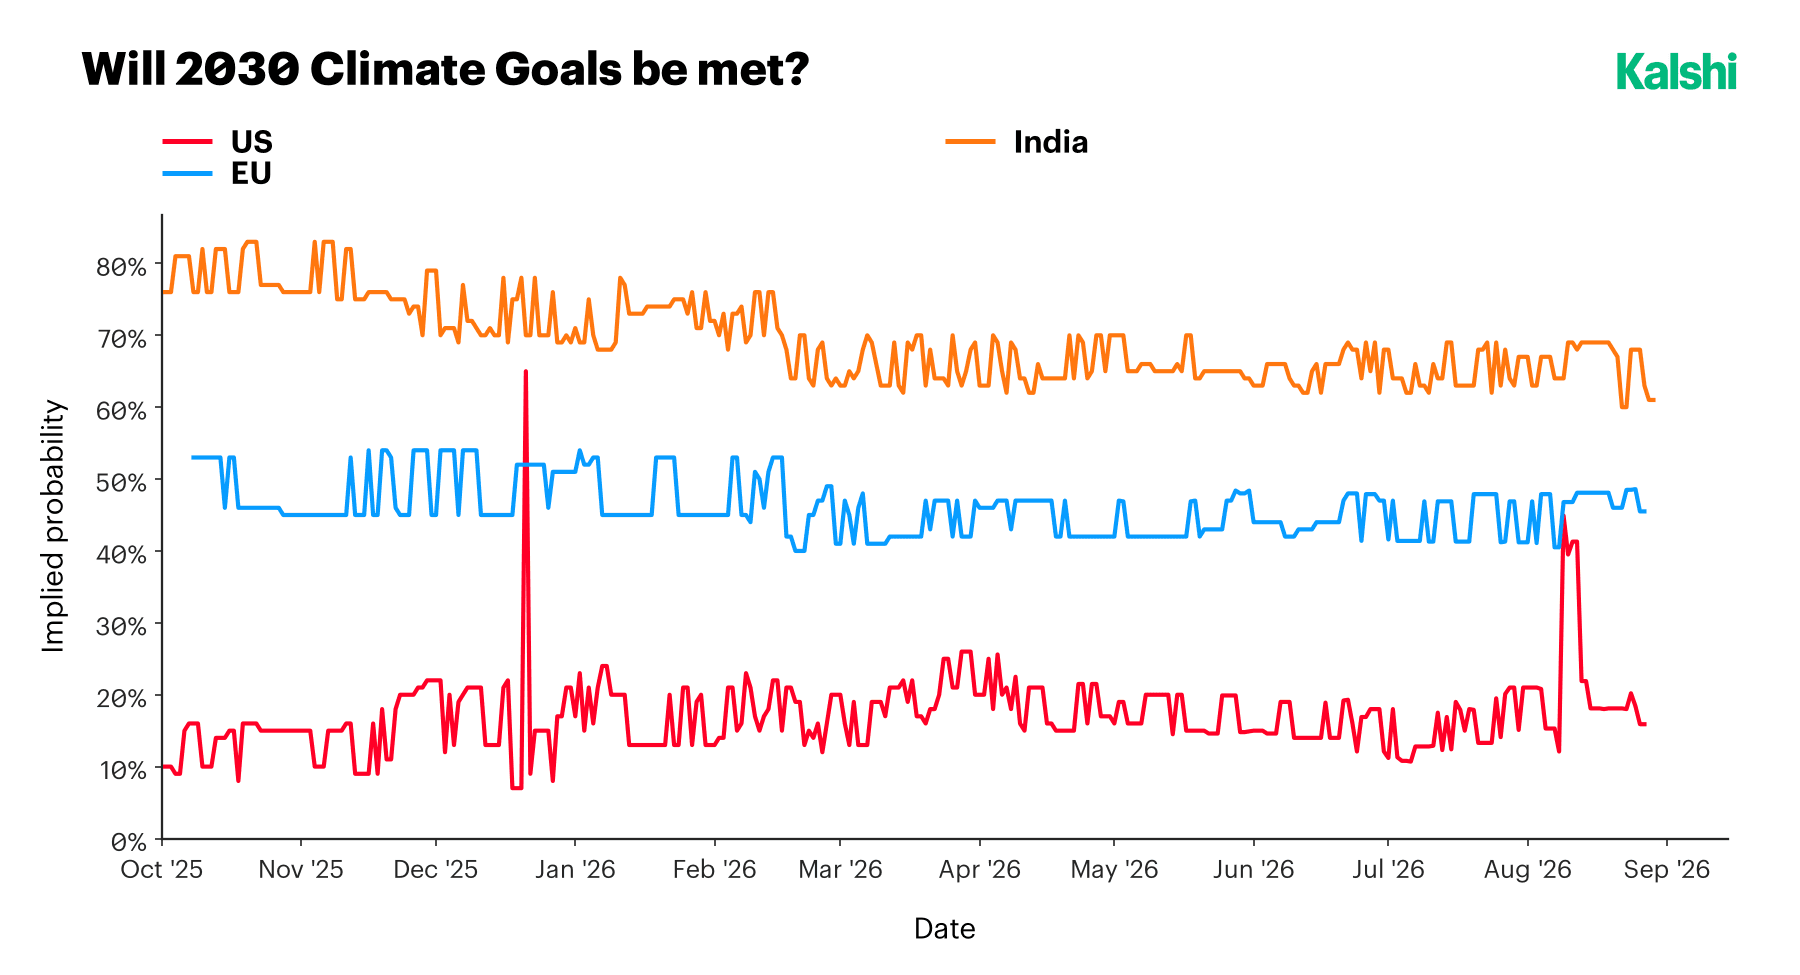
Separately, Kalshi lists markets on whether major economies will meet their stated 2030 greenhouse gas targets. The United States has committed to a 50–52% reduction in emissions below 2005 levels by 2030; the European Union to a 55% reduction from 1990 levels; and India to a 45% reduction in emissions intensity from 2005 levels, alongside a target of 50% non-fossil power generation capacity. Over the period shown, the U.S. target has generally been priced in a 10% to 25% implied-probability range, aside from a brief spike around year-end 2025 and a rise to roughly 40% in August 2026 that has since partly reversed. The EU target has traded in a comparatively narrow 40% to 55% band. India’s target has been priced highest of the three throughout the period but has drifted down from roughly 78% in late 2025 to the low 60s by late summer 2026.
Enjoying this? Get our next piece of research as soon as it's out.
Hurricanes
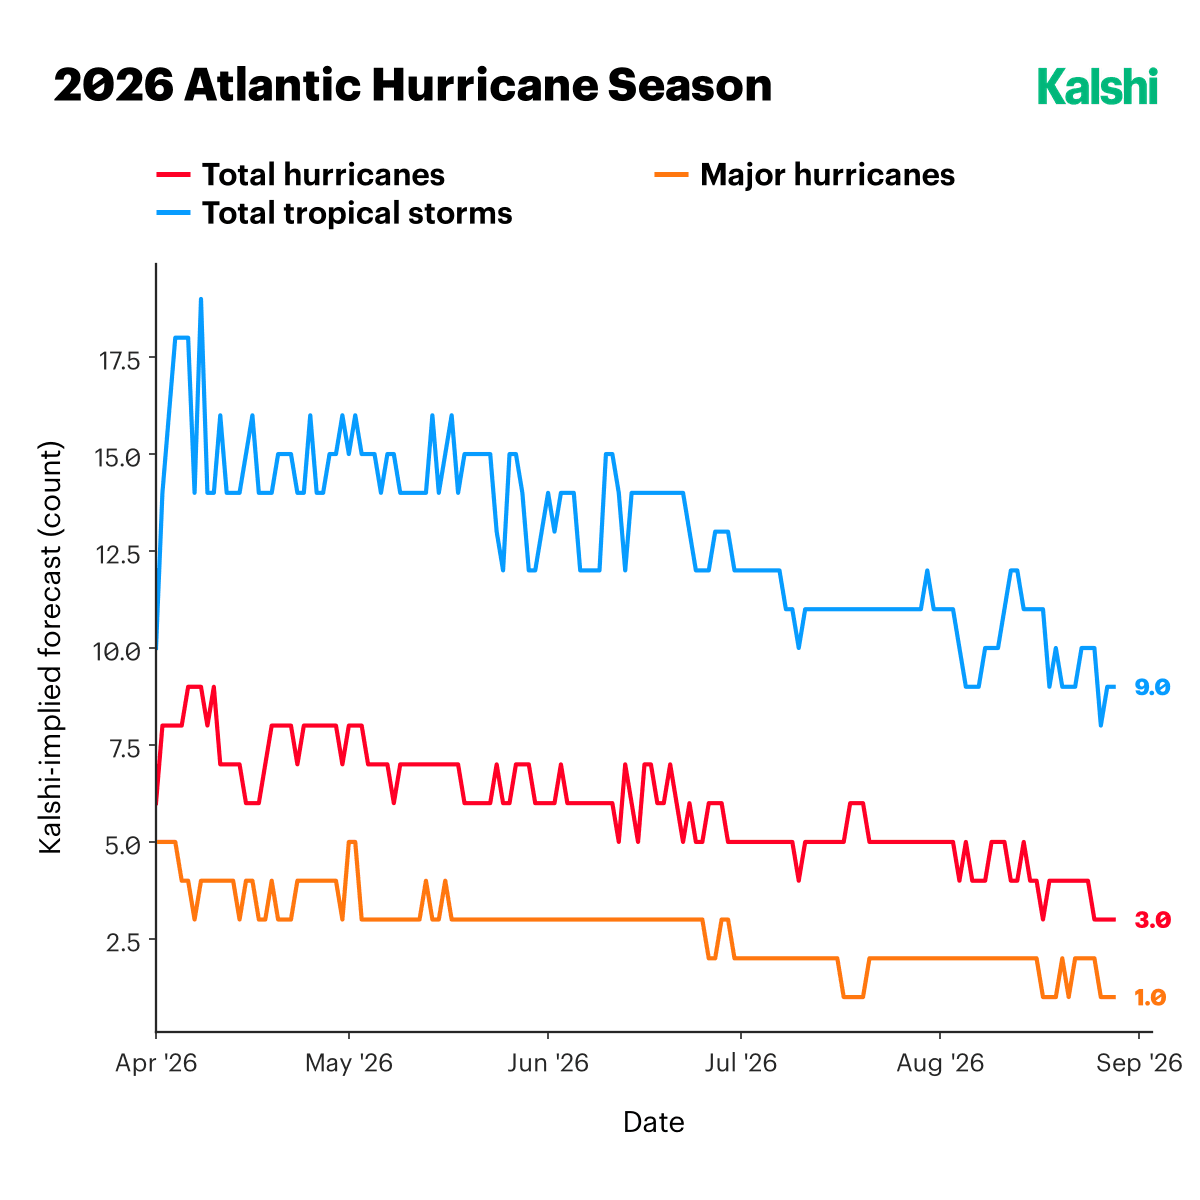
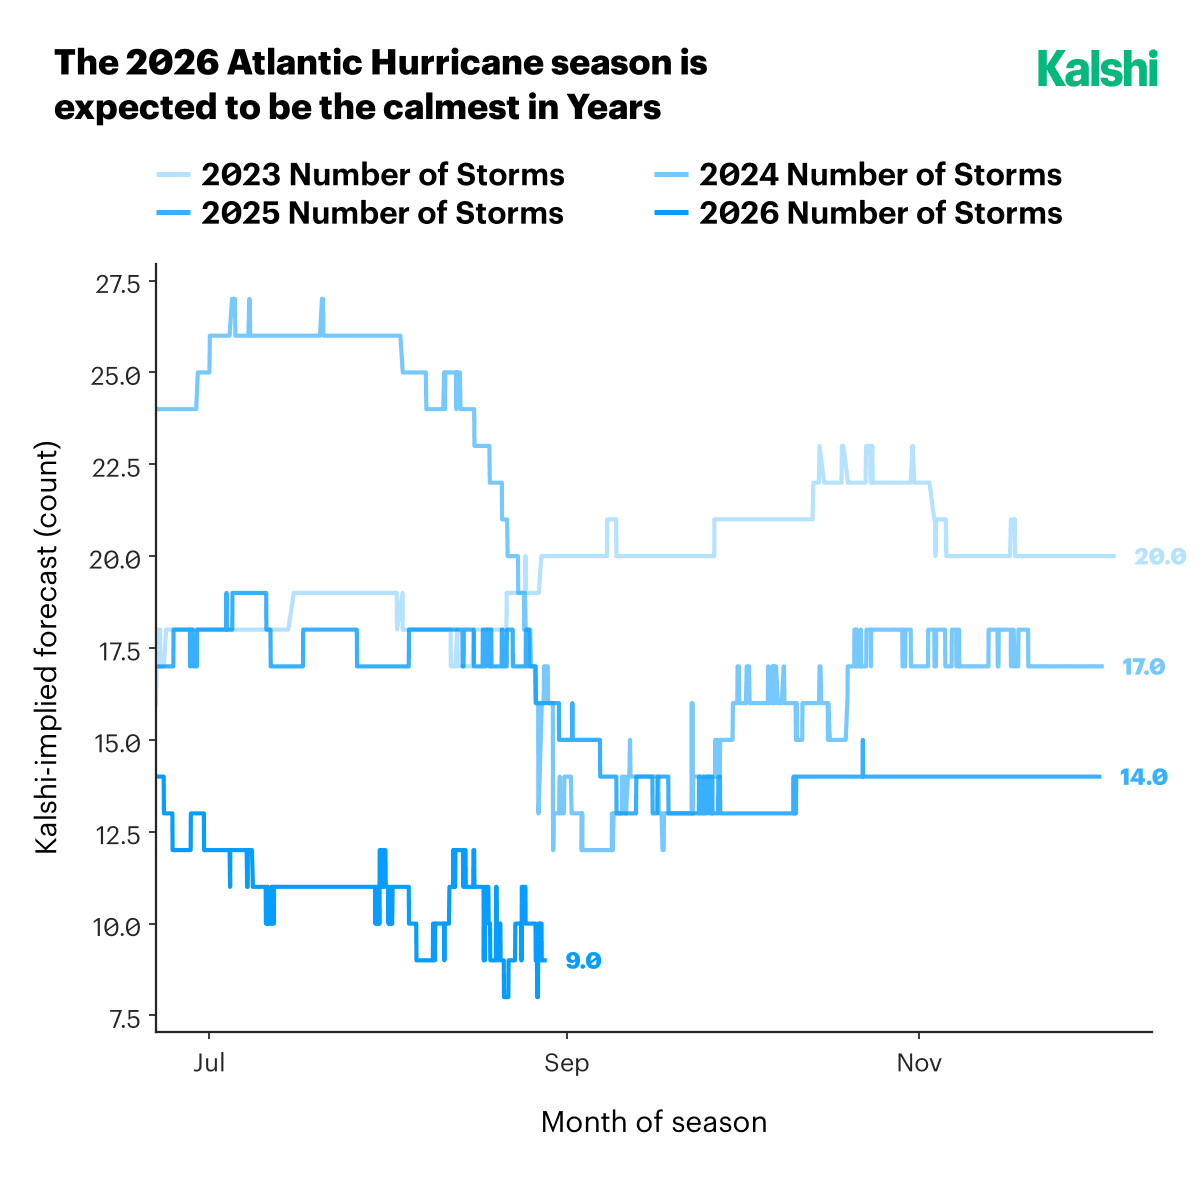
NOAA’s outlook published May 21, 2026 called for 8 to 14 named storms, 3 to 6 hurricanes, and 1 to 3 major hurricanes in the Atlantic basin for the season running June through November. Kalshi’s hurricane markets were within that range at the time and have since converged toward its lower end: as of late August, the market-implied full-season forecast stood at approximately 9 named storms, 3 hurricanes, and 1 major hurricane, with four storms having formed and no hurricanes yet recorded. For comparison, market-implied forecasts for total named storms at a comparable point in the season (mid-to-late August) stood at roughly 20 in 2023, 17 in 2024, and 14 in 2025, so the 2026 figure of roughly 9 would extend a declining trend observed across the three prior seasons. That said, the comparison set is only four seasons, and Atlantic hurricane activity is known to vary substantially year to year for reasons, including El Niño/La Niña cycles and sea surface temperature anomalies, that are not captured in this dataset.
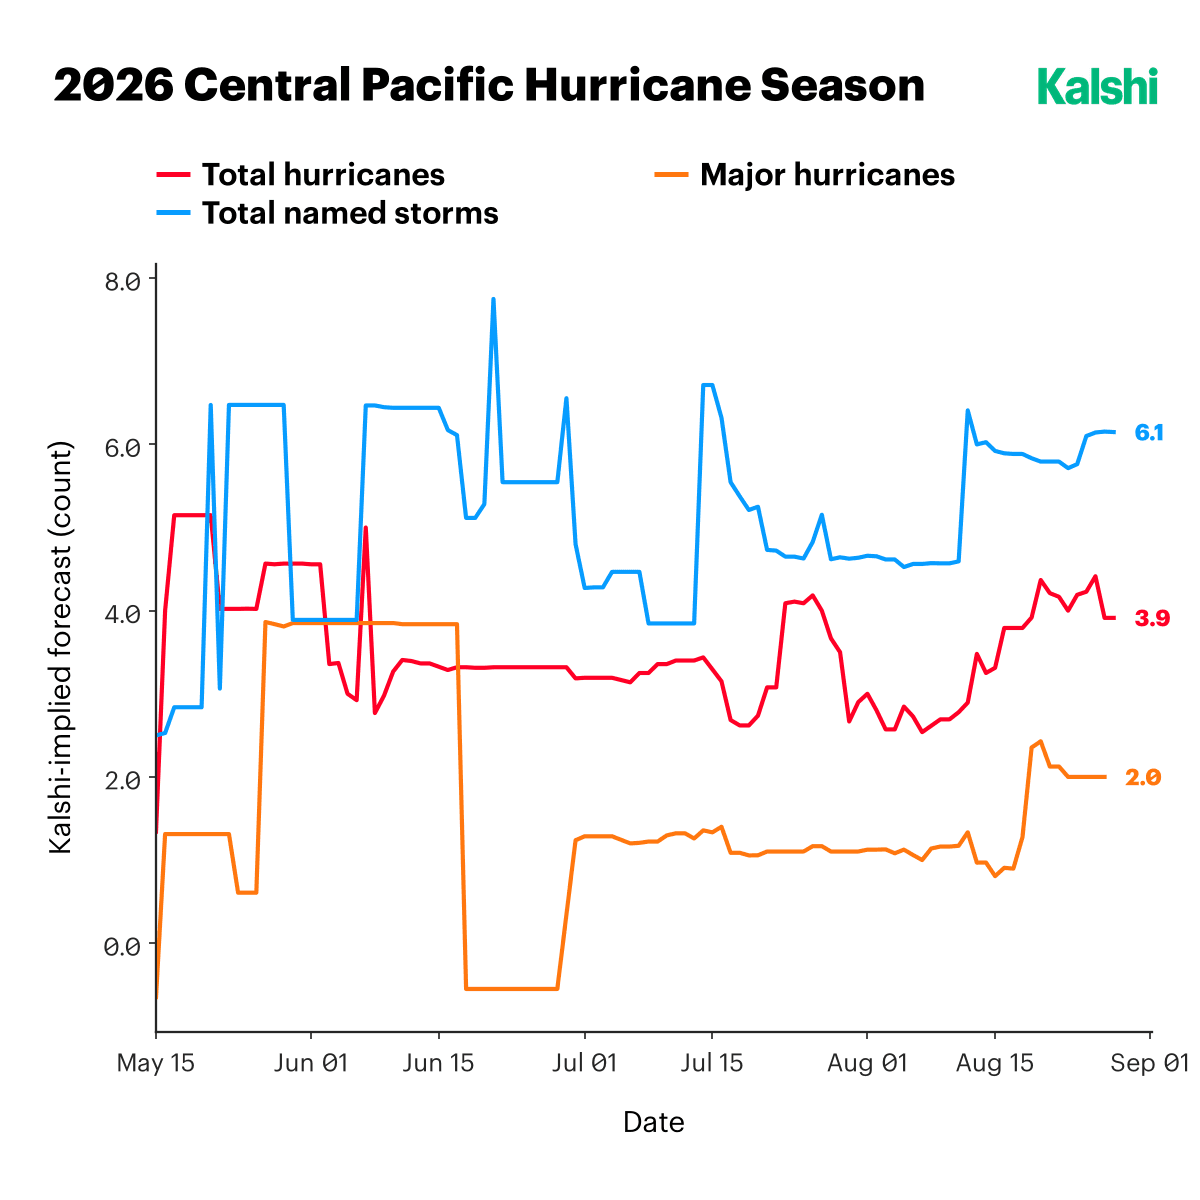
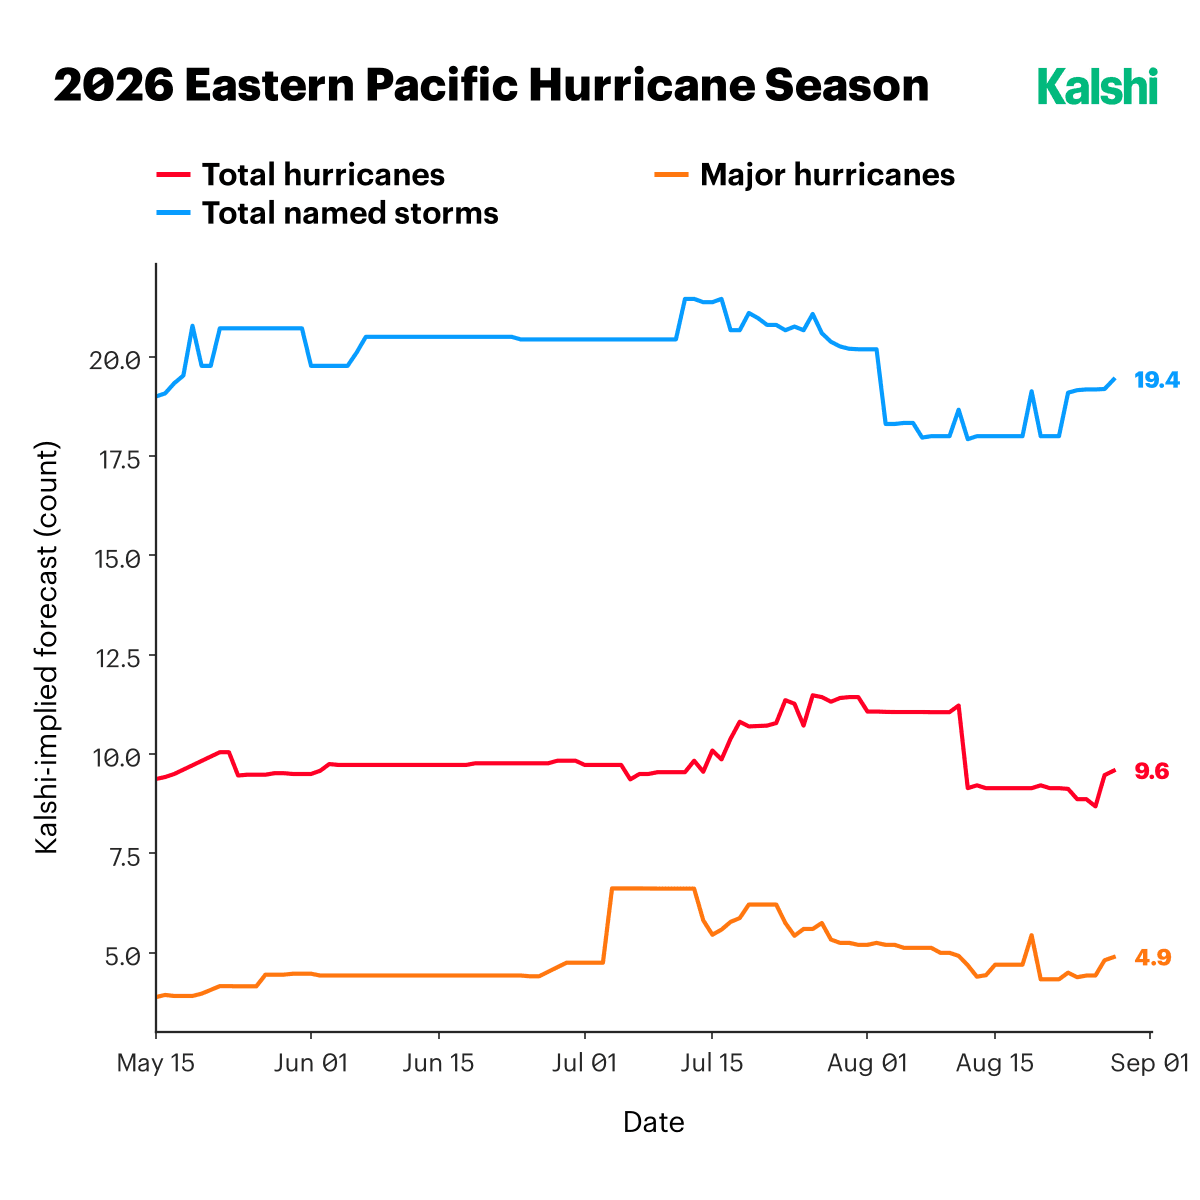
Since 1980, hurricanes have caused an estimated $1.5 trillion in cumulative U.S. damage, averaging approximately $2.5 billion per storm, though loss severity is highly skewed toward a small number of major landfalling storms. Kalshi’s Central Pacific markets currently imply 6.1 named storms and 2.0 major hurricanes for the season; its Eastern Pacific markets imply 19.4 named storms and 4.9 major hurricanes.
Tornados
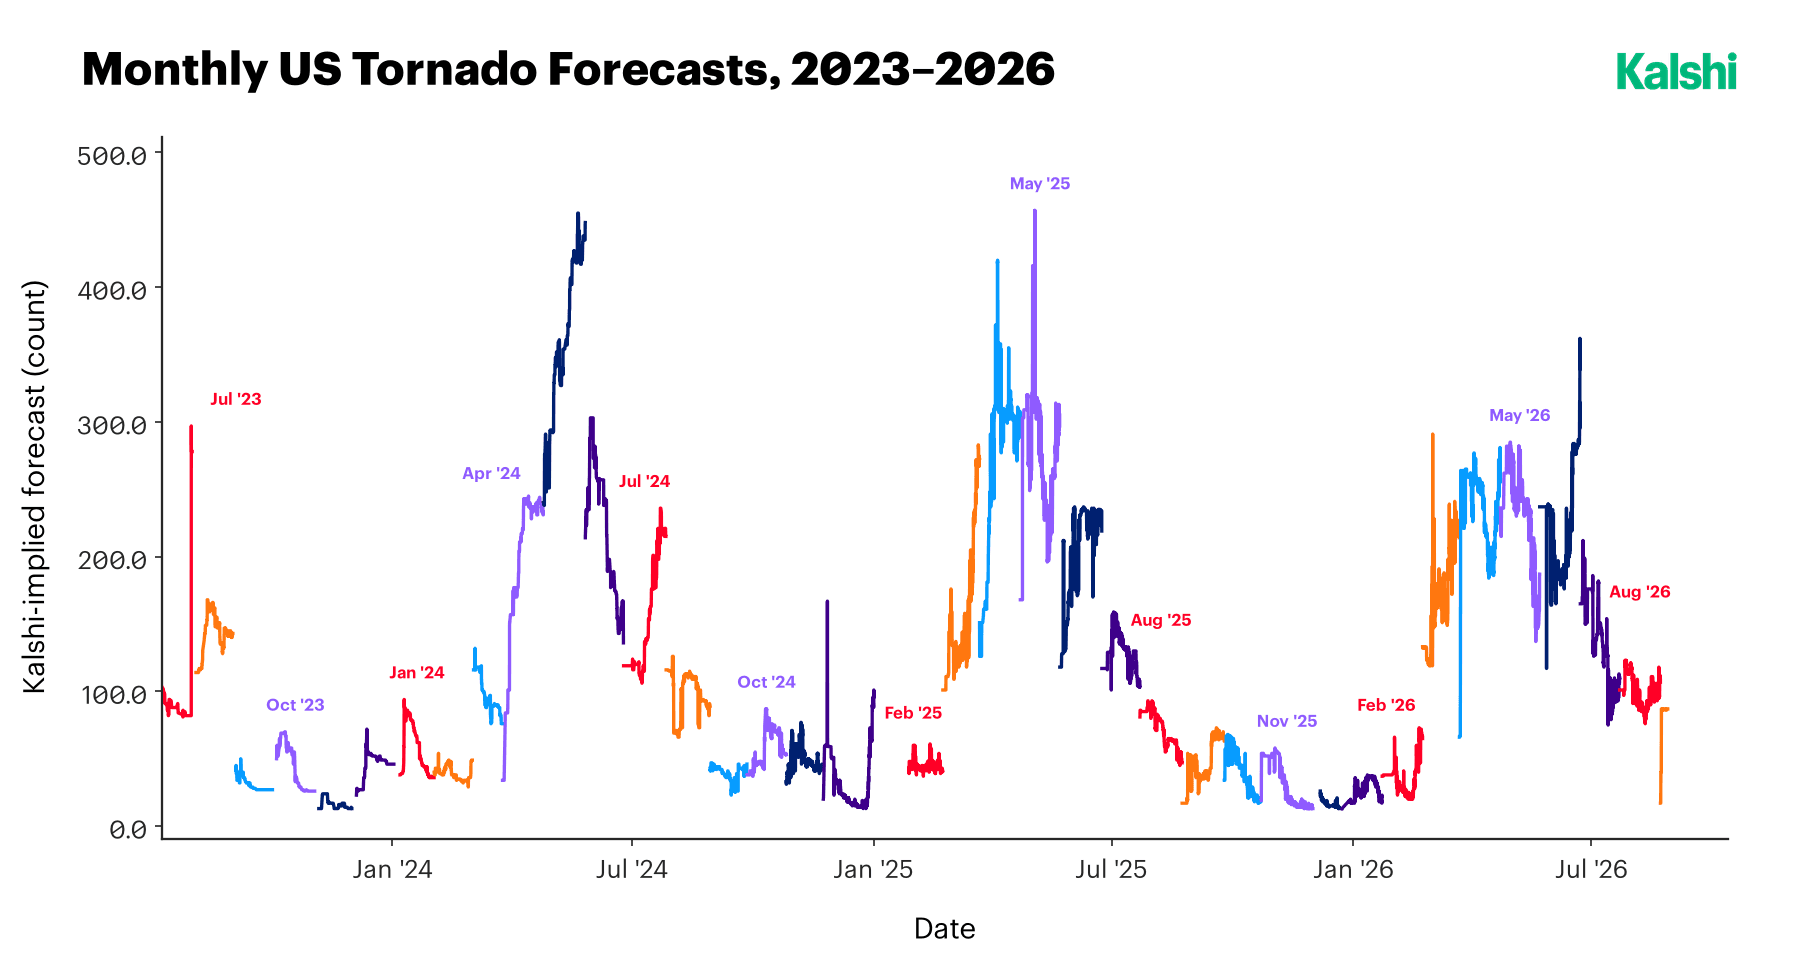
Kalshi lists monthly markets on the number of tornadoes recorded in the United States. Tornado activity is seasonal, with historical activity typically peaking in May in connection with jet stream patterns. Market-implied forecasts from 2023 through 2026 show this seasonal shape clearly, with each year’s series rising into a spring or early-summer peak before declining toward year-end, and with considerable month-to-month volatility (implied forecasts for a given month have ranged from under 50 to over 400 across the period shown). The market-implied forecast for August 2026 stood at 96 tornadoes as of the report date, above the 54 recorded in August 2025. The average annual cost of U.S. tornado damage is estimated at $4.6 billion, roughly an order of magnitude below cumulative hurricane losses, broadly consistent with tornadoes causing more geographically concentrated, individually smaller-scale damage.
Hedging Weather-Dependent Revenue: The Use Case for Businesses
Because Kalshi’s weather contracts are exchange-traded and continuously priced, they can in principle be used by businesses with weather-sensitive revenue to offset some of that exposure, in a manner similar to how traditional over-the-counter weather derivatives have been used since the 1990s, historically by larger counterparties given the customization and minimum-size conventions typical of that market.
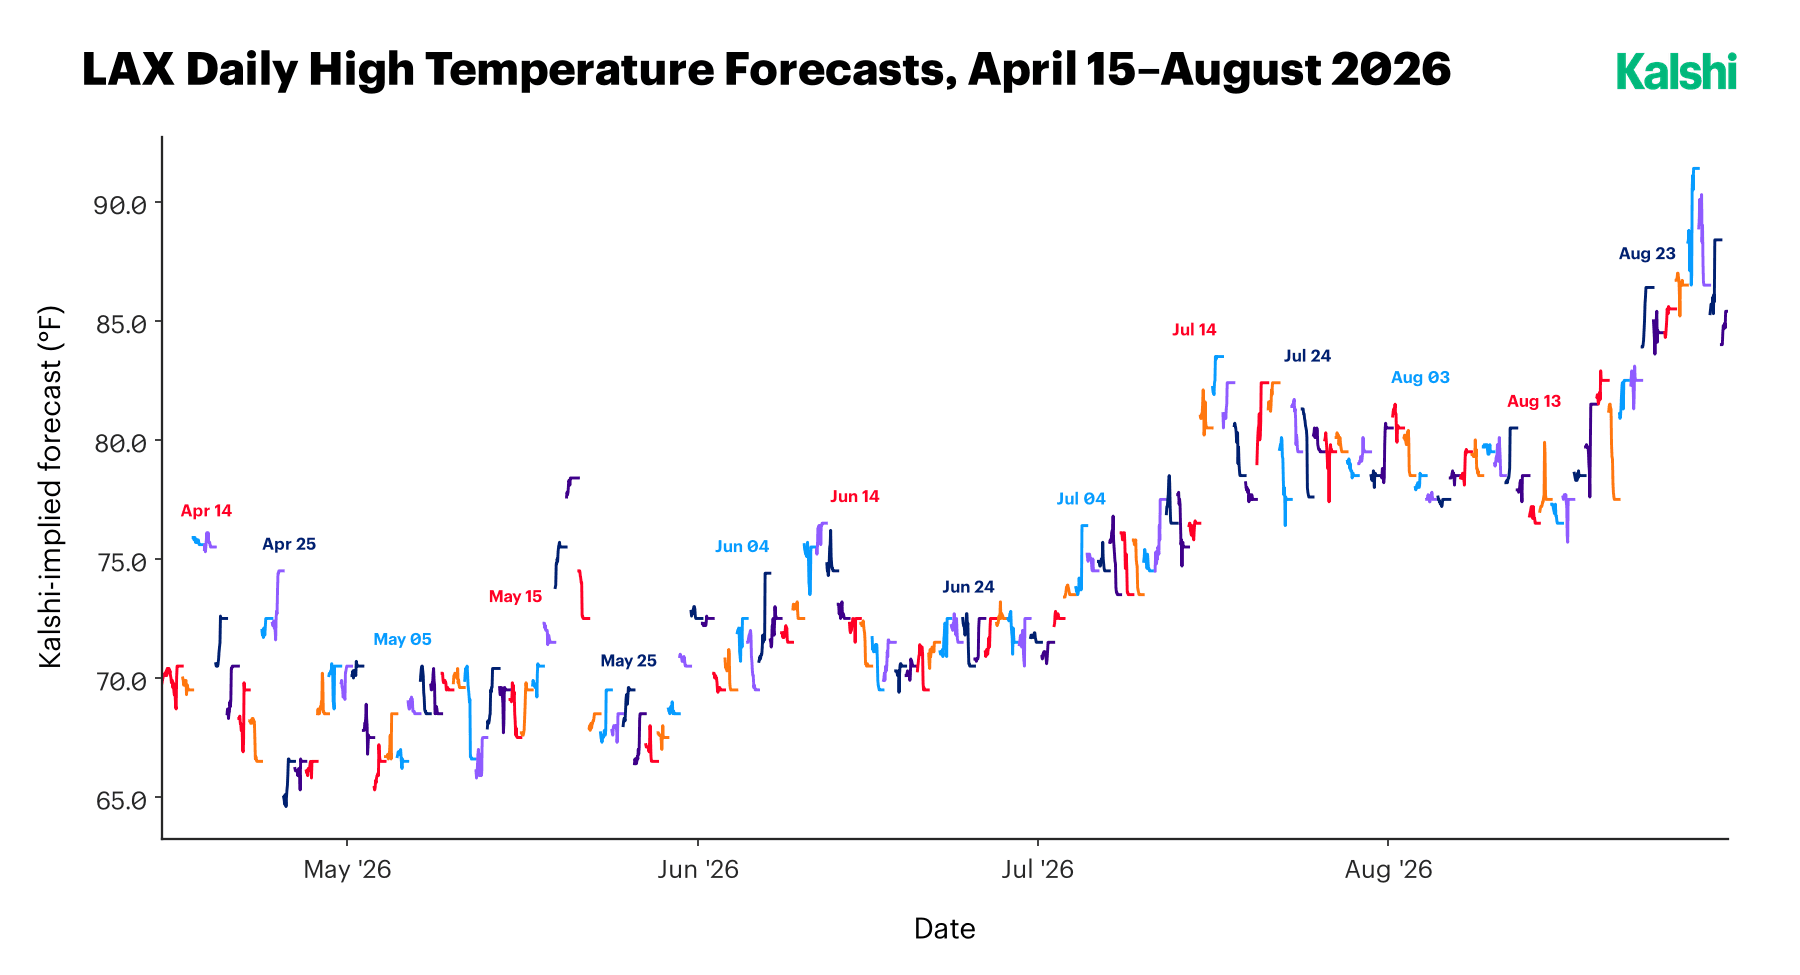
For instance, 28 Wishes in Los Angeles, an ice cream shop, realised that their sales declined approximately 20% whenever temperatures dipped below 70°F. Their hedges on Kalshi have paid out $1,500 a month, equivalent to 43% of the business’s monthly rent in that period.
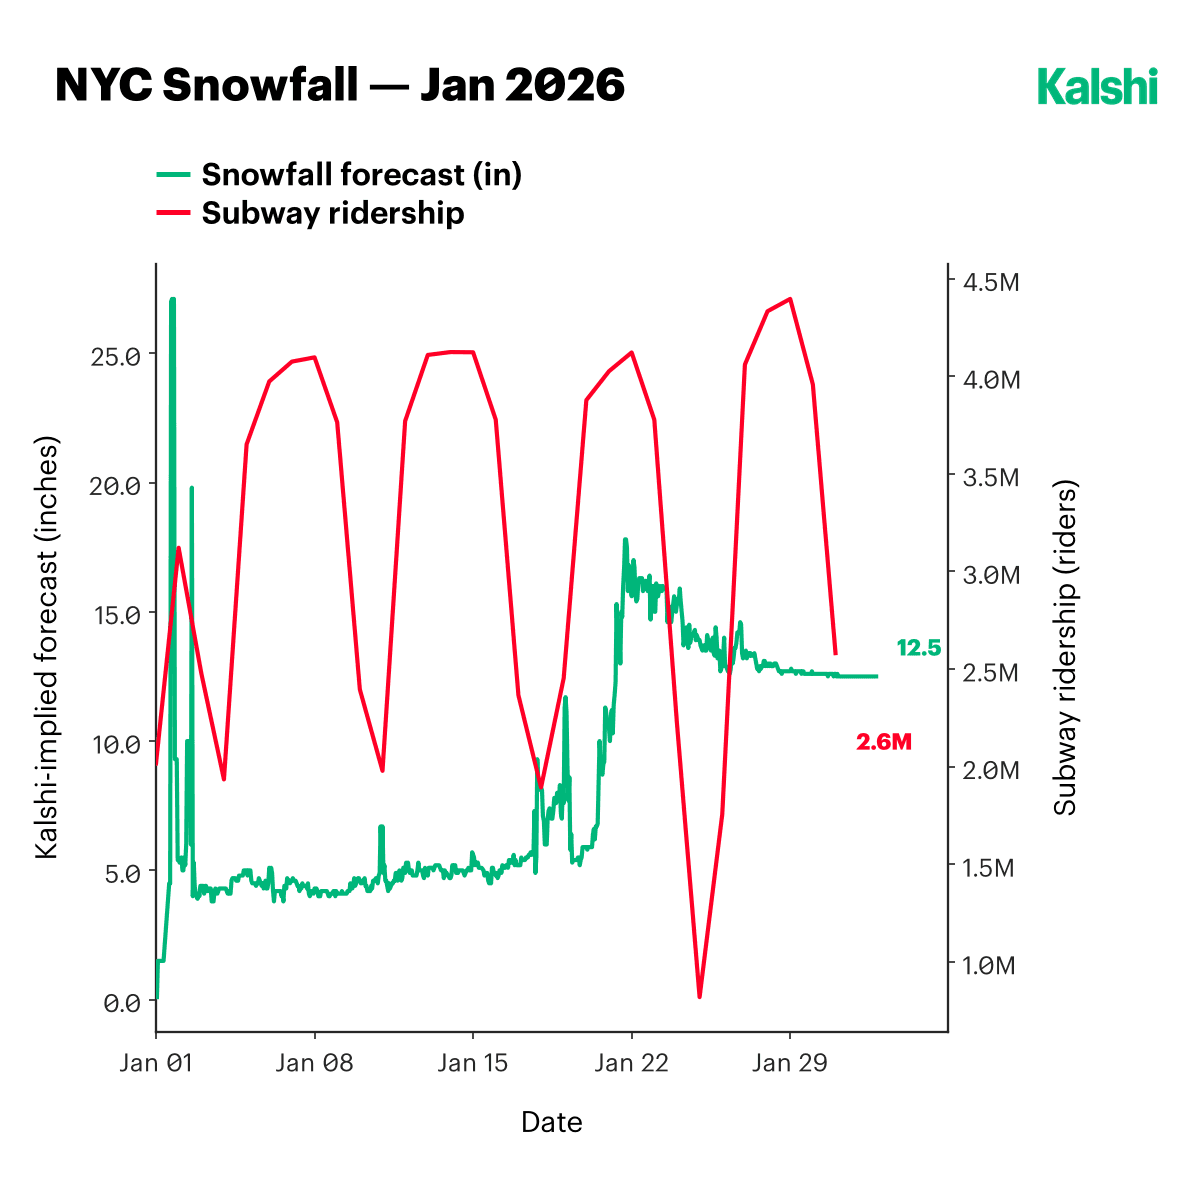
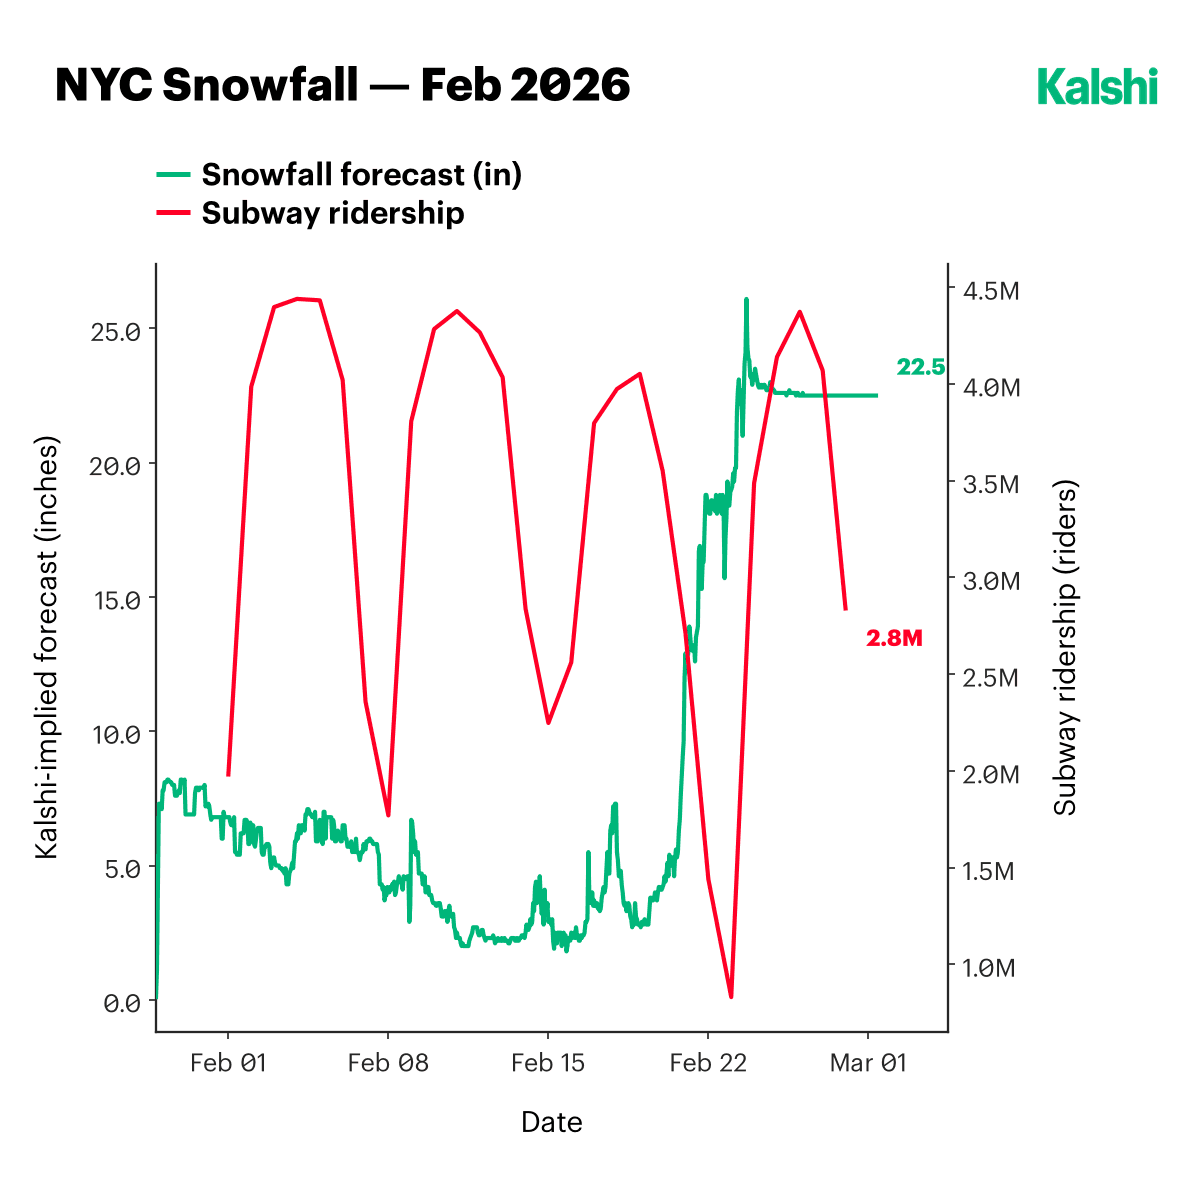
Closer to home, New York experienced two significant snowstorms in January and February 2026. Daily subway ridership, plotted alongside Kalshi’s snowfall forecasts for each month, fell by up to 1 million riders on the days of heaviest snowfall relative to typical levels earlier in each month. A hedge established at the start of each month using Kalshi’s snowfall markets would, based on this chart, have been positioned to pay out around the time of the ridership declines shown, given the inverse relationship between snowfall and subway usage visible in the data. As with the Los Angeles example, this is an illustrative case rather than a rigorous backtest: it does not account for the cost of establishing the hedge, the position size needed to offset a given amount of revenue risk, or the correlation between citywide ridership and the revenue of any specific business.
Conclusion
The more interesting question raised by this data is not whether Kalshi’s weather markets are accurate, the daily calibration data are hard to argue with, but who is positioned to make use of them. Traditional weather derivatives have existed for decades, but their OTC structure, bespoke contract terms, and large typical notional sizes have effectively restricted them to sophisticated counterparties with dedicated risk-management resources. An exchange-traded contract referencing a single city and a single day, at a minimum size accessible to a small business, is a structurally different instrument, and the evidence reviewed here suggests the pricing mechanism behind it is, at minimum, working with the businesses using it.
About Kalshi Research
Signal-rich analysis of prediction markets. Questions, data access (currently free for institutional clients), or collaboration: research@kalshi.com
Reference Material
- Felbermayr, Gabriel, Jasmin Gröschl, Mark Sanders, Vincent Schippers, and Thomas Steinwachs. "The Economic Impact of Weather Anomalies." World Development 151 (2022): 105745. https://doi.org/10.1016/j.worlddev.2021.105745
- International Chamber of Commerce. "The Economic Cost of Extreme Weather Events: Cost Economy $2 Trillion over the Last Decade." November 11, 2024. https://iccwbo.org/news-publications/policies-reports/new-report-extreme-weather-events-cost-economy-2-trillion-over-the-last-decade/
- Krentcil, Faran. "Savvy Ice Cream Shop Owner Makes 43% of Monthly Rent Betting on Weather: 'If It Rains, We Still Win.'" New York Post, July 16, 2026. https://nypost.com/2026/07/16/lifestyle/california-ice-cream-shop-owner-bets-on-weather-to-help-pay-rent/
- Metropolitan Transportation Authority. "Day-by-Day Ridership Numbers." MTA Metrics. Accessed August 30, 2026. https://metrics.mta.info/?ridership/daybydayridershipnumbers
- National Oceanic and Atmospheric Administration. "NOAA Predicts Below-Normal 2026 Atlantic Hurricane Season." News release, May 21, 2026. https://www.noaa.gov/news-release/noaa-predicts-below-normal-2026-atlantic-hurricane-season
Disclaimer
This report is published by Kalshi Inc. (“Kalshi,” “we,” or “us”) for informational and educational purposes only. It is not investment, legal, tax, or trading advice, and it does not constitute a recommendation or solicitation to buy, sell, or hold any event contract, security, or other financial instrument. Nothing in this report creates a fiduciary, advisory, or professional-client relationship between Kalshi and the reader.
Kalshi operates a CFTC-regulated exchange. The event contracts and forward curves referenced herein are traded on or derived from Kalshi’s platform. The market prices, forward curves, and implied probabilities cited in this report reflect what market participants thought at a given moment; such data is subject to change without notice. These figures are not guarantees or predictions of actual outcomes. Past and current prices do not indicate future results. Data sourced from third parties is believed to be reliable but has not been independently verified. Third-party projections and estimates cited herein are subject to significant uncertainty and may not be realized.
Trading event contracts carries risk, including the risk that you may lose some or all of your invested capital. Event contract outcomes are binary and can result in the total loss of the amount paid for a contract. Every figure and probability here is current only as of the date of publication. Kalshi undertakes no obligation to update, revise, or correct this report after publication.
Kalshi, its affiliates, officers, directors, and employees may have financial interests in the contracts or markets discussed herein and may trade them at any time without notice to readers.
This report is not directed at any person in any jurisdiction where its distribution or the offering of event contracts would be contrary to local law or regulation. Before acting on anything in this report, consult your own independent legal, tax, financial, or other professional advisor.
This report is not insurance advice and does not constitute a recommendation regarding the purchase, renewal, or cancellation of any insurance policy or program. Comparisons between event contracts and insurance products are illustrative only and do not account for differences in regulatory protections, counterparty credit risk, claims processes, coverage scope, or policyholder rights that may apply to traditional insurance. Readers should consult a licensed insurance professional before making decisions about their insurance or risk-transfer arrangements.
Get new Kalshi Research publications and insights as they are released.