
Over a Barrel: Midterm Elections and Oil
Published September 21, 2026
Download PDF- The continued Iran conflict is driving voters to the left. It’s long been understood that people vote with their hip-pocket. KPOW has now flipped to show a D grip on power and the Senate control contract is trading 60% – a cycle high.
- A once-transient oil shock appears to be priced for stickiness. As projections for the reopening of Hormuz continue to be pushed back, the price of oil appears to be telling a higher-for-longer story.
- States with refinery operations aren’t in the clear. Operational issues across the United States has meant even states with their own refinery operations have been affected by significant service disruptions and elevated cost.
The Oil Situation Is Taking a Toll on Republicans
Republicans are defending 22 of the 35 Senate seats on the ballot this cycle, including special elections in Ohio and Florida. That math was fixed once filing closed in the spring. The price of gasoline was not, and it has moved against the seats Republicans need to hold.
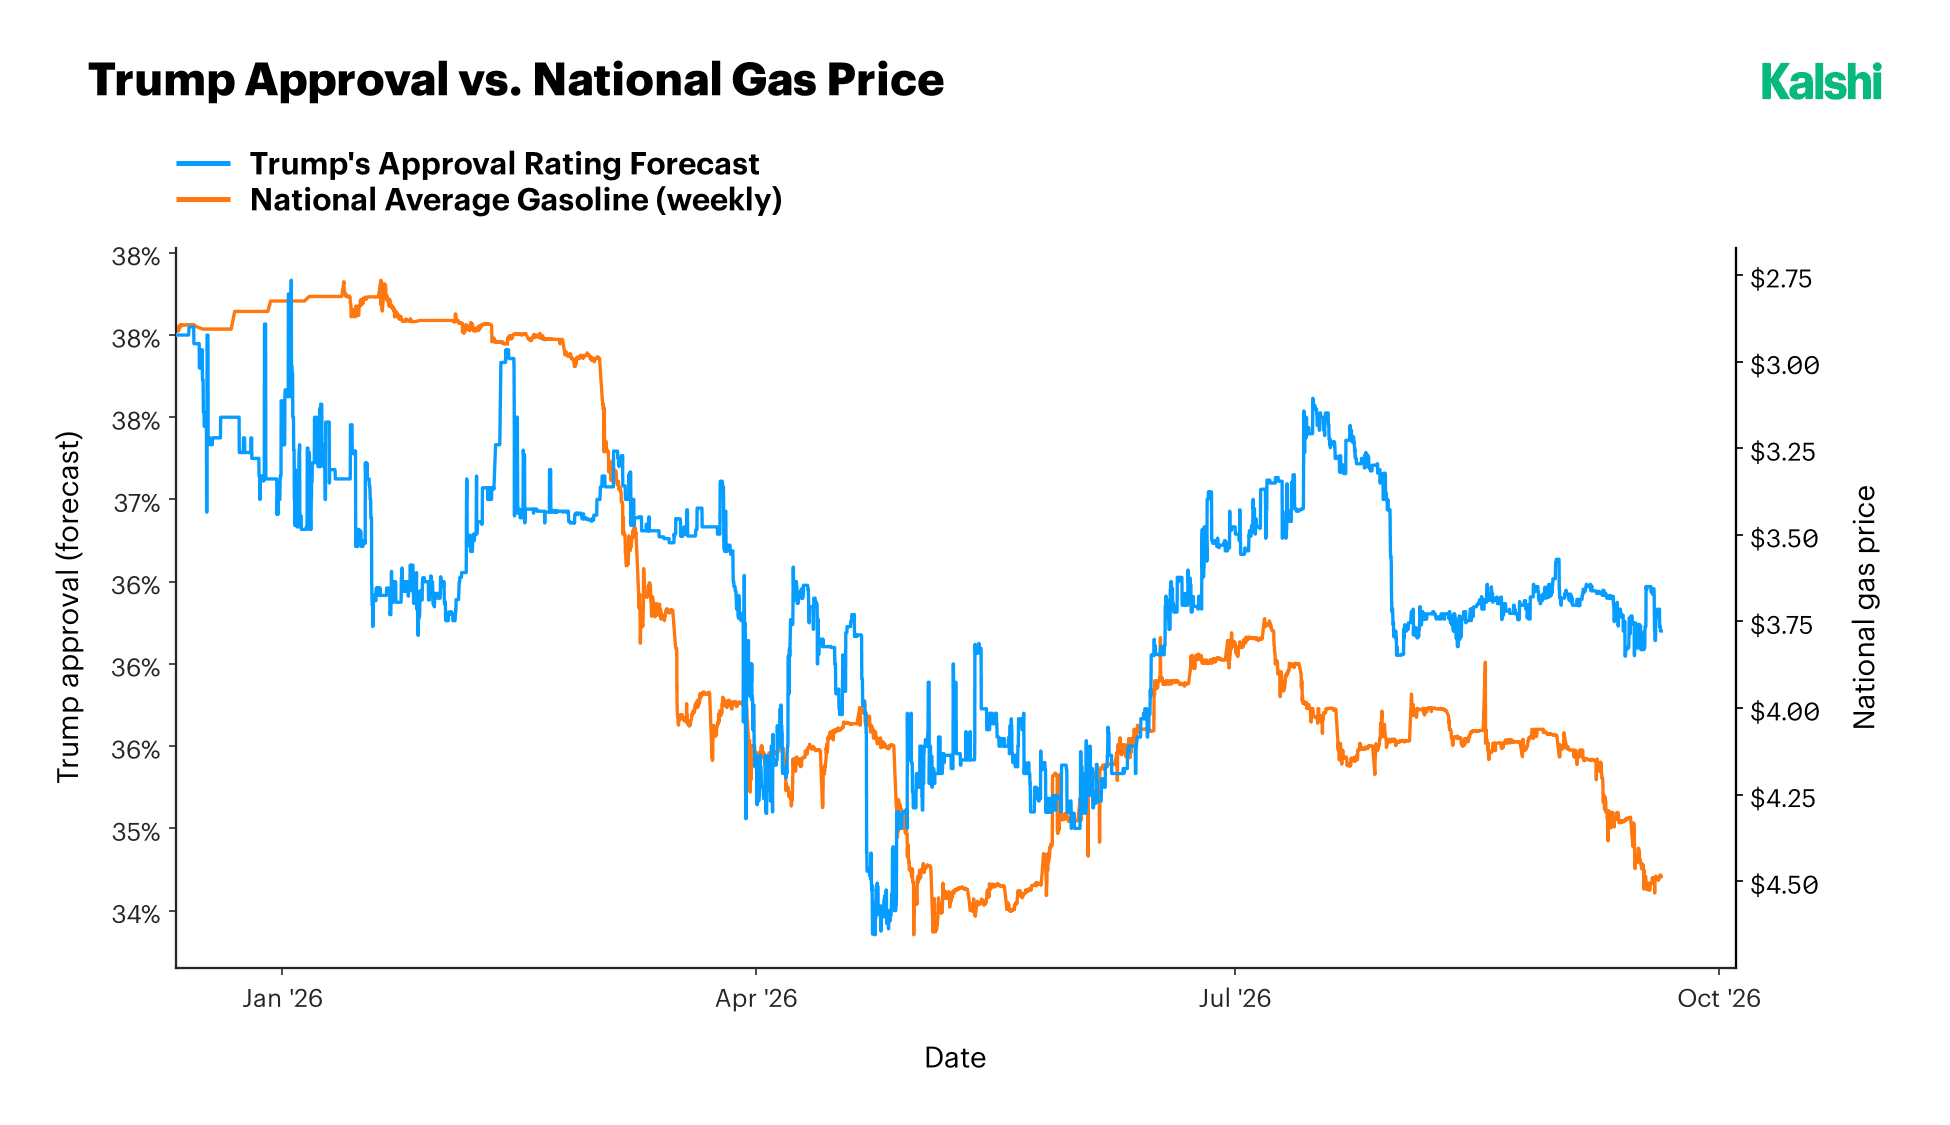
Starting at the top, our forecast for President Trump’s approval has tracked the national gasoline price closely all year, generally moving the same direction with a short lag. Approval sat near 38% in January alongside $2.70 gas, fell to a low near 34% by June as the price climbed toward $4.50, recovered modestly through the summer as prices eased, and has drifted back down to roughly 36% as gasoline climbed past $4.40 again in September. The pattern has held for nine months: when gas gets more expensive, approval gets worse, on a lag measured in weeks rather than months. Of course, correlation isn’t causation, since gas prices and approval could both be responding to broader political developments.
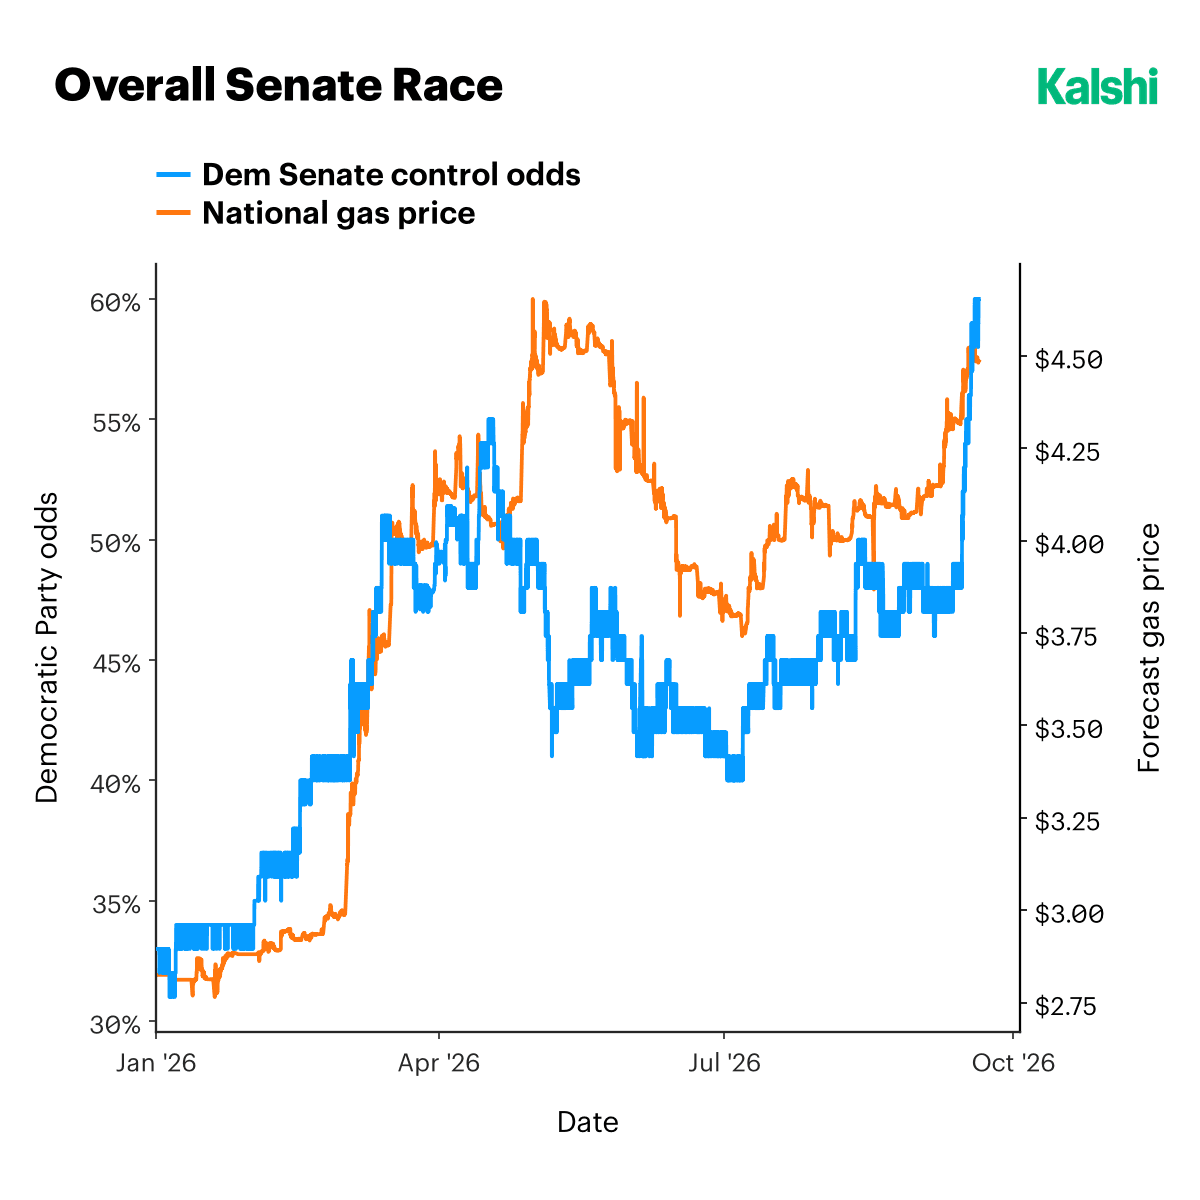
That approval pattern shows up directly in the Senate contract. Democratic control of the Senate opened the year at 33%, crossed 50% in late March as the Iran conflict began, peaked at 55% in April, fell back to 41% in May as a ceasefire briefly held, and bottomed at 40% in early July. It has since climbed to 60%, a new high for the cycle, with roughly half of that gain arriving in a single week in mid-September, the same week gasoline resumed its climb toward $4.50.
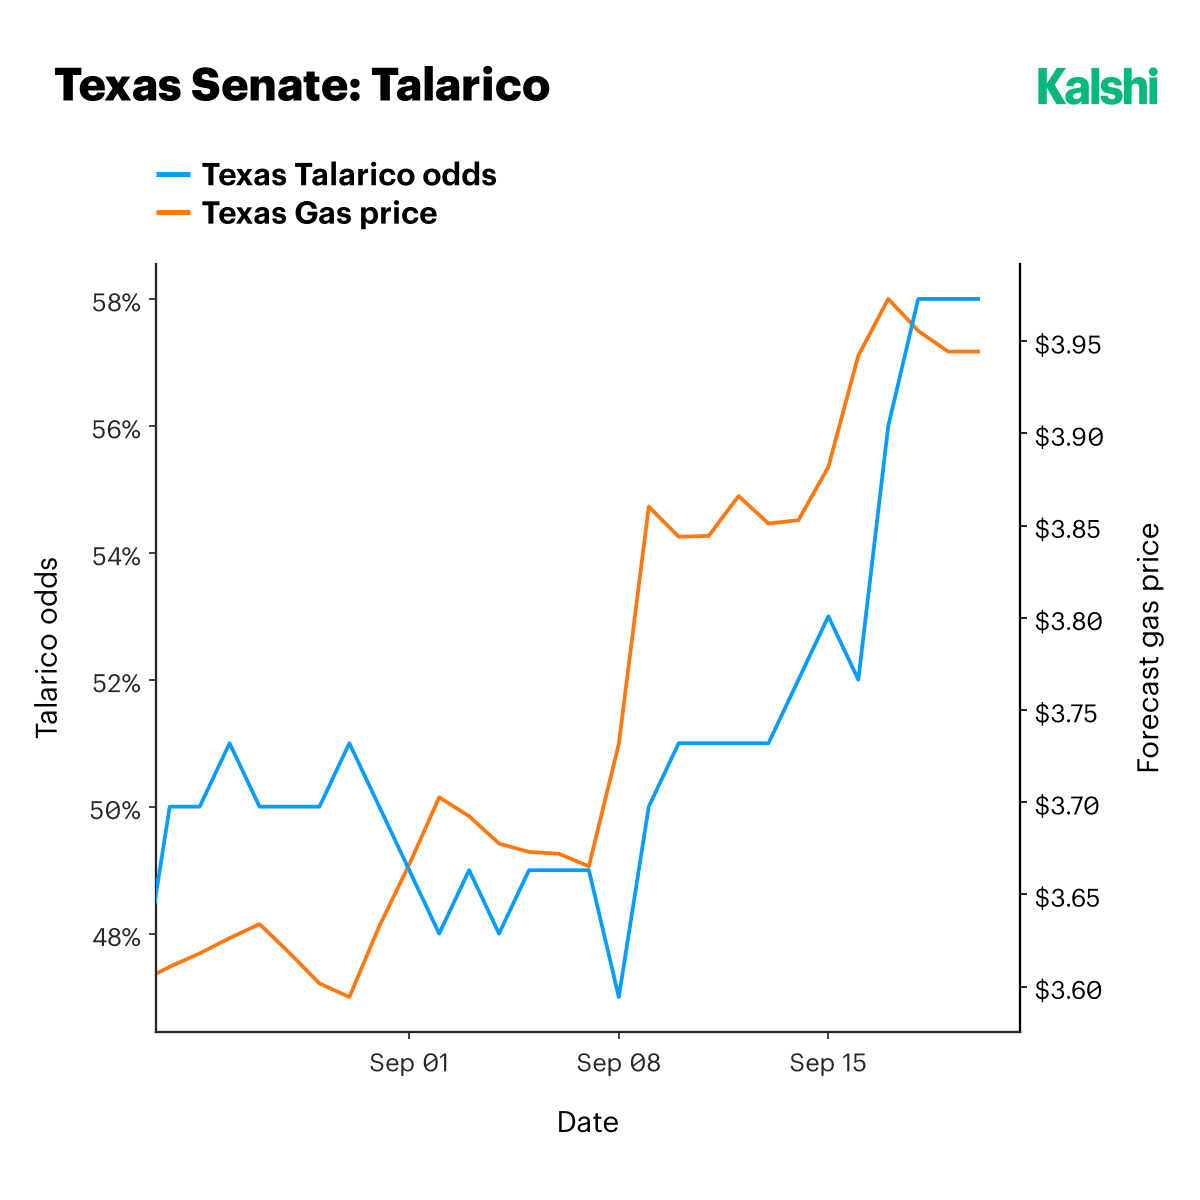
Texas is the clearest single case of the mechanism at work, because it has both its own gas price and its own Senate contract, updating against each other in real time. James Talarico’s contract held a flat range between 47% and 51% from late August through September 8. Texas pump prices broke higher that day, moving from $3.67 to $3.86 in two days and on to $3.98 by the 17th. Talarico’s contract followed one to two days behind: 47% on the 8th, 51% on the 9th, and 58% by the 17th, where it has held since. Though Texas is an independently tight race, we have now seen an eleven-point move in nine trading sessions, tracking a state price series with a consistent lag.
New Kalshi Research, straight to your inbox.
The Situation in the Straits
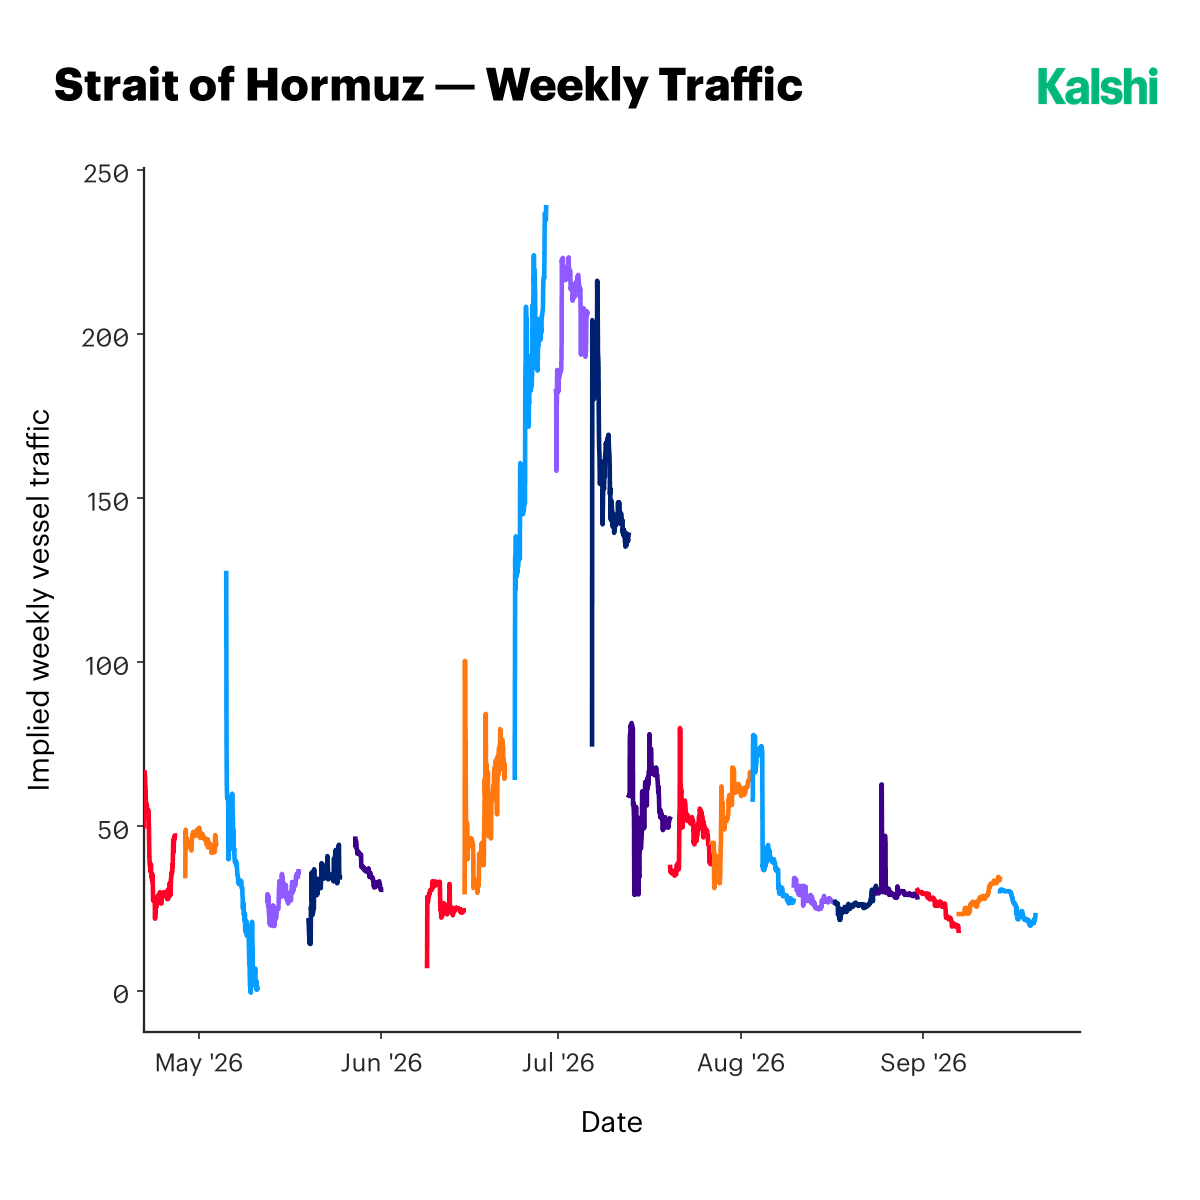
The Strait of Hormuz, a channel that accounts for ~20% of the global transit of oil, has been effectively closed to routine commercial traffic since the Iran conflict began. Little reprieve has been seen throughout the year, with the weekly traffic contract spiking to 240 in early July, in the window between an April 8 ceasefire and the U.S. Navy’s return to blockade duty on July 14, then collapsing to trade within a 22-to-35 range since August. It sits near 22 now, against a pre-war baseline of roughly 125 vessels a day.
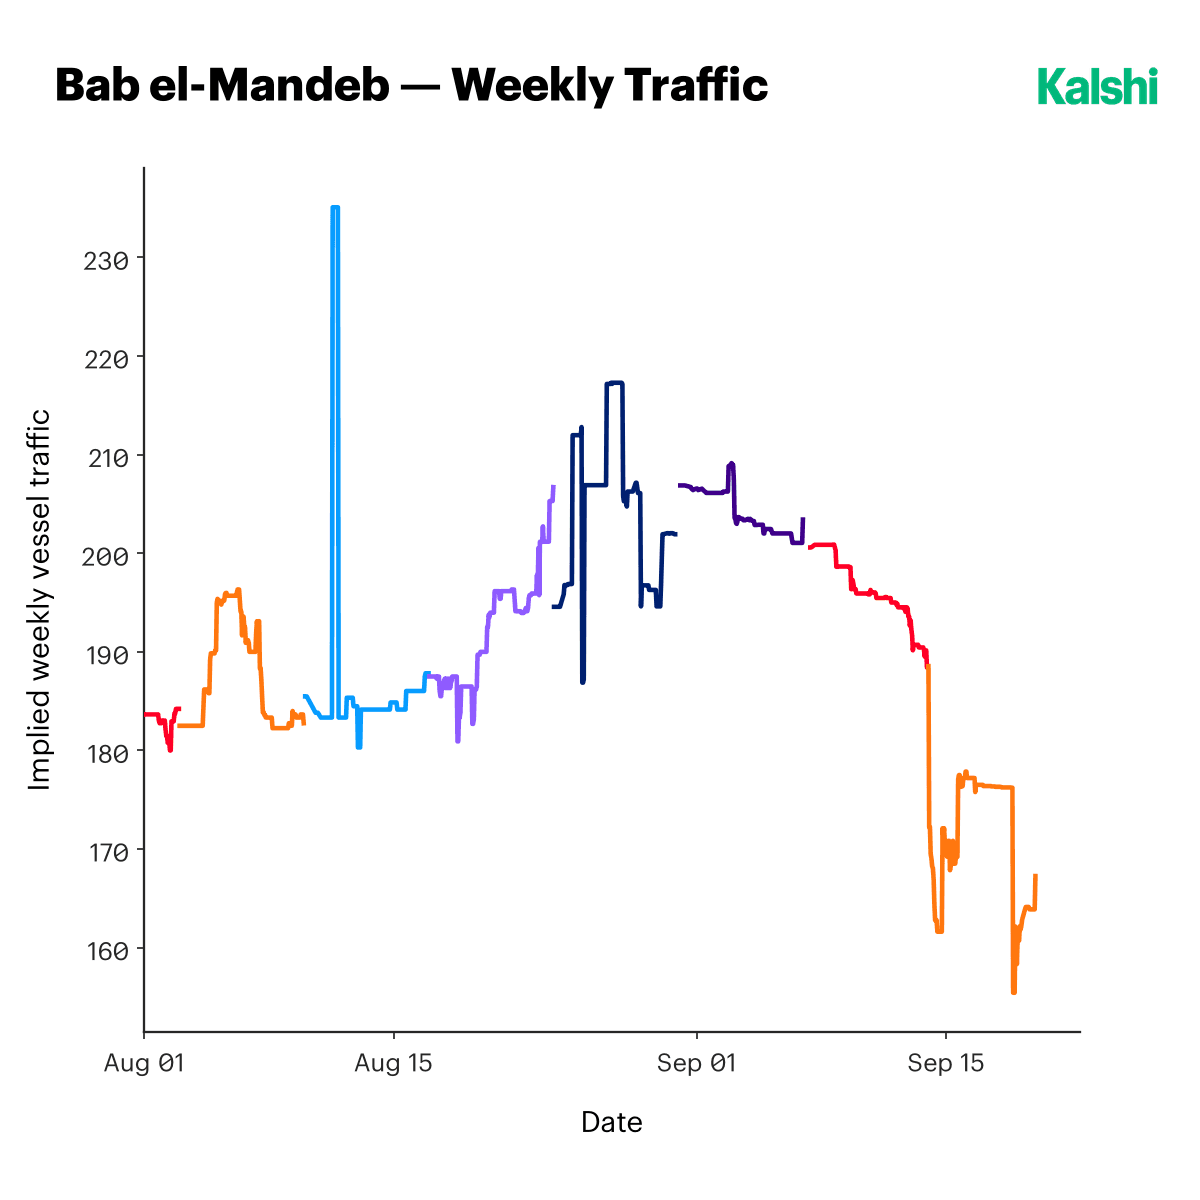
In early September, Houthi forces seized the Red Sea port of Mocha and the island of Perim, both at the mouth of the Bab el-Mandeb strait, the route ships had been using to avoid Hormuz. Our Bab el-Mandeb traffic contract had held between 180 and 217 through August. It has fallen to 165 since. Then, on September 10 and 11, drone strikes launched from Iraq hit Saudi Arabia’s East-West Crude Oil Pipeline, and Riyadh shut the line on the 11th. That pipeline moves up to five million barrels a day from Saudi Arabia’s eastern oil fields to the Red Sea port of Yanbu, and it was the kingdom’s main way of exporting crude without touching Hormuz at all. Brent crude traded to $110 a barrel and settled near $105, its first close above $100 since May. The International Energy Agency put Saudi crude supply at its lowest level in more than three decades.
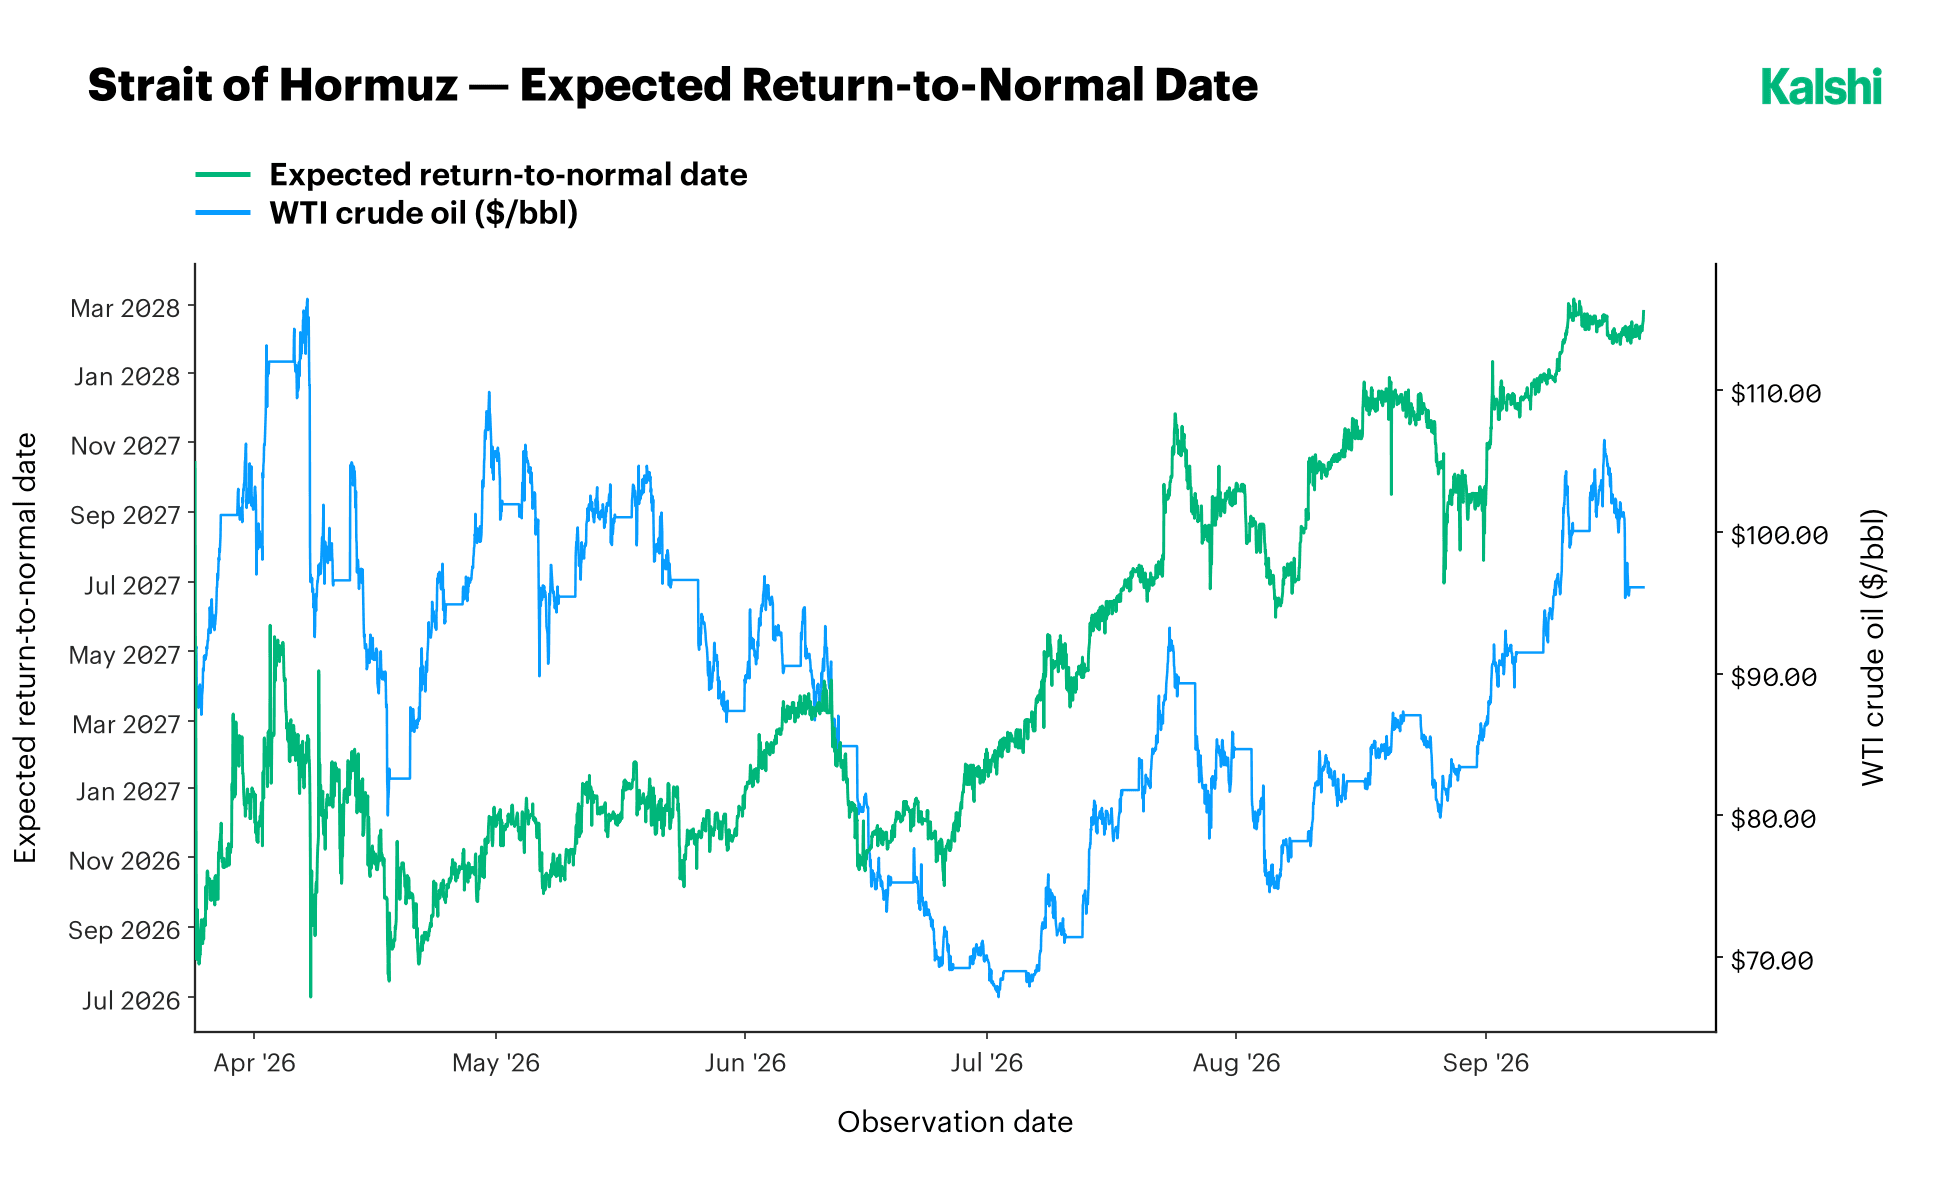
Our contract on when Hormuz returns to normal is the cleanest way to see how the market’s view of the operation in the Middle East has changed; specifically, how it has re-priced a transient oil shock into something much stickier. In late March it priced a return by September 2026. By early April, on hopes the ceasefire would hold, it had pulled in to July 2026. It has moved the other way every month since: past November 2026 in May, past January 2027 in June, through most of 2027 over the summer, and out to March 2028 now.
The relationship between that date and the price of crude tells you what kind of shock this is. Through April, the two moved in opposite directions: crude climbed above $113 while the expected reopening date pulled closer, indicative of a war premium assumed to be transient. Since crude’s trough near $68 in early July, the two have moved together: crude back above $100, and the reopening date pushing further out at the same time. The war premium thesis has faded: this now looks much more like a fundamental repricing of the oil supply.
Enjoying this? Get our next piece of research as soon as it's out.
Effects on U.S. Gas Prices
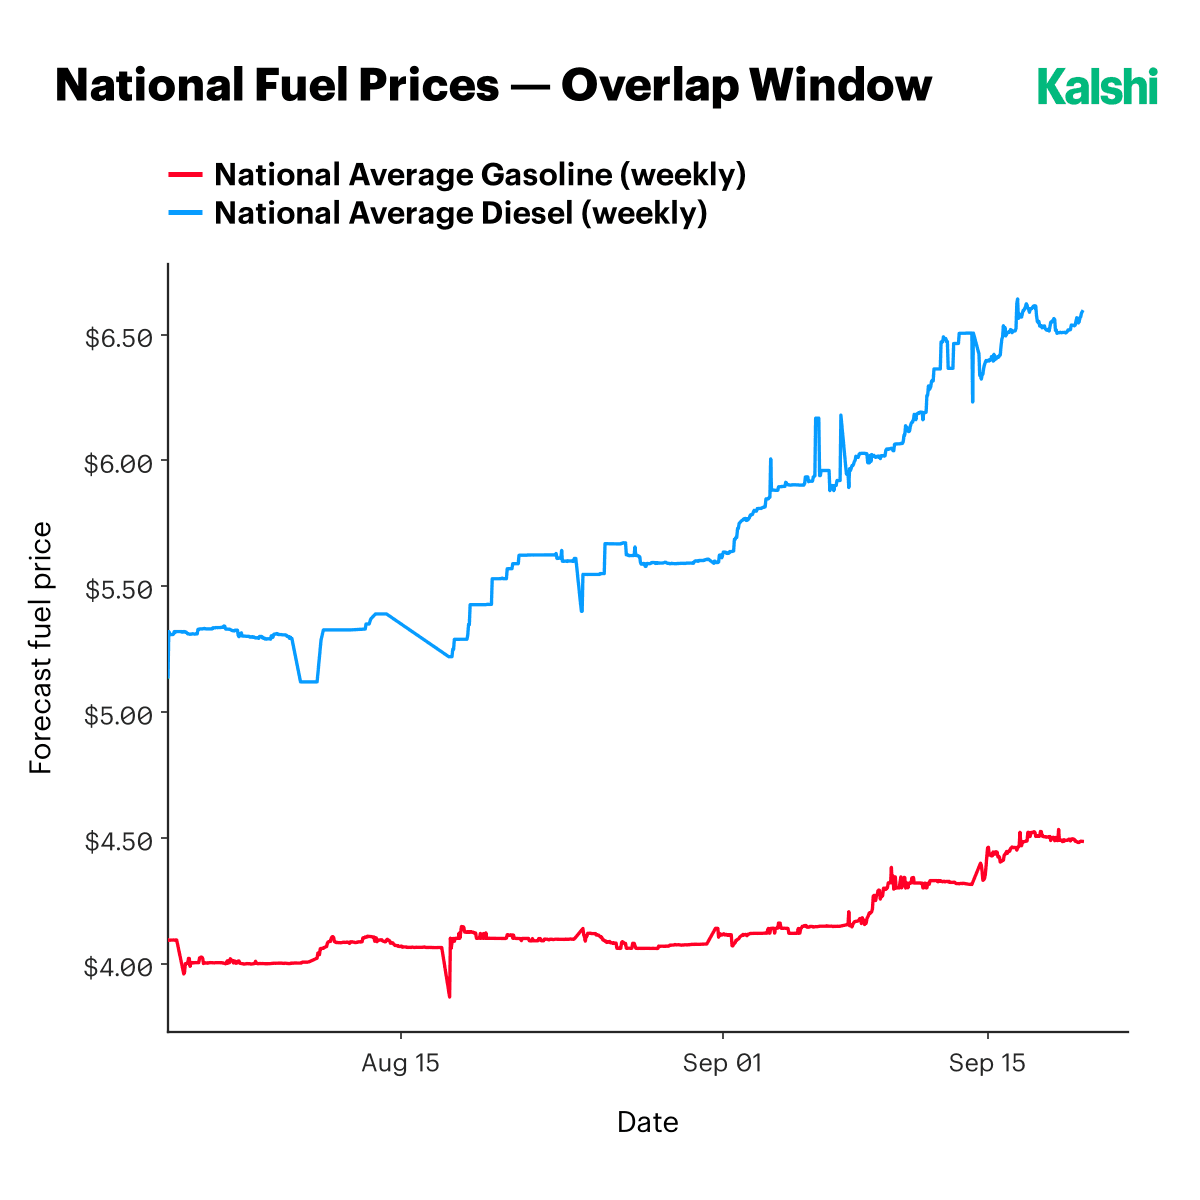
The shock has reached the pump, and it appears is telling a story of a series of unfortunate events. National gas prices held between $4.05 and $4.10 through August, turned higher after Labor Day, and reached $4.50 by September 17. Diesel moved further and faster, from $5.30 in early August to a record $6.57, a 24% move against gasoline’s 10%. AAA’s own weekly survey confirms the path: $4.14 on September 3, the highest price ever recorded for the Labor Day weekend, against a prior record of $3.82 set in 2012, and $4.43 by the 17th, more than a dollar above where it stood a year earlier.
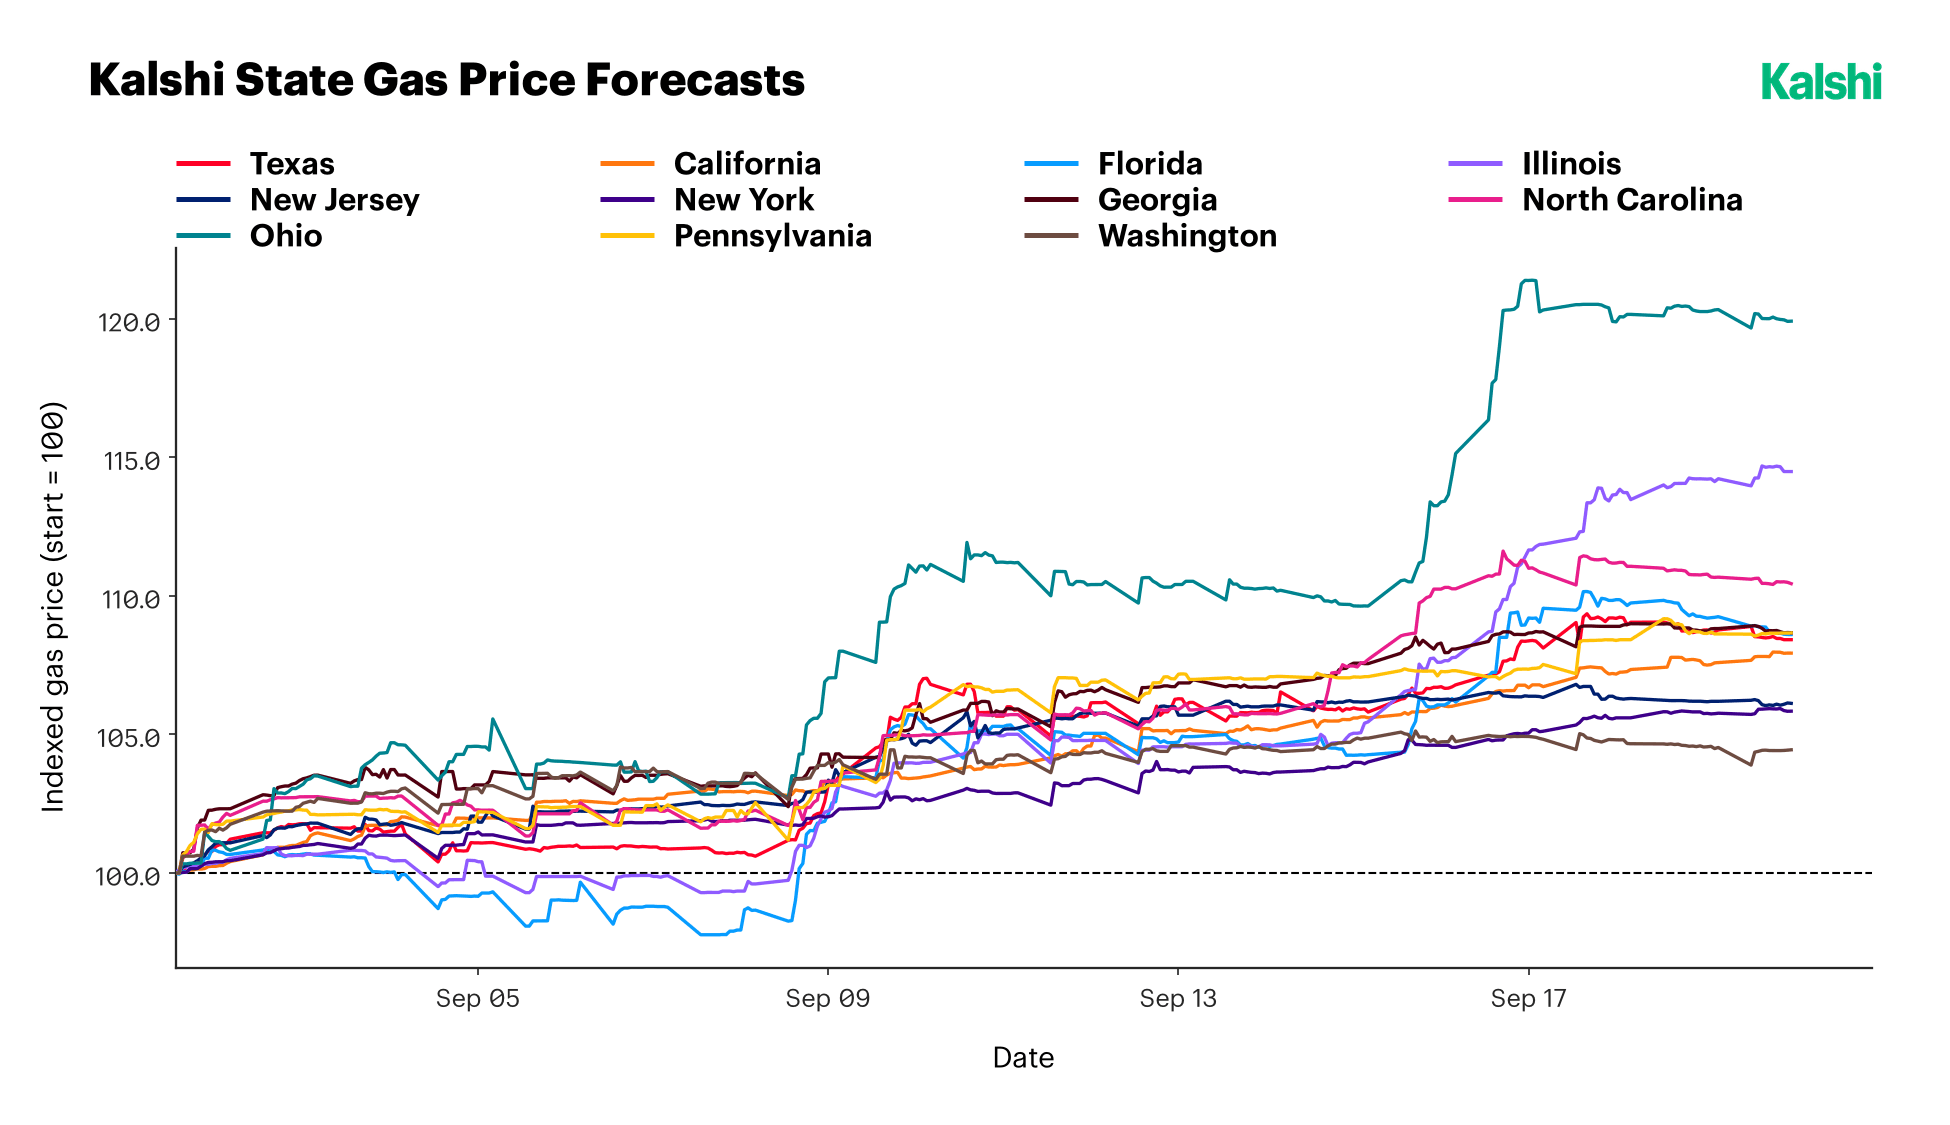
That average hides which states are actually driving the political numbers above. The chart is indexed to 100 at the start of September to isolate the size of the move rather than the level, since the states that pay the most for gas in absolute terms are not the states where the price is moving fastest – those are rather states that are telling a refinery story, too. ExxonMobil’s Joliet refinery in Illinois, which processes 275,000 barrels a day, went offline after a power outage and subsequent flooding. Cenovus’s Lima refinery in Ohio, at 185,000 barrels a day, is in planned maintenance through mid-October. BP’s Whiting refinery in Indiana, at 440,000 barrels a day, is in an unresolved labor dispute.
Ohio is up 20% on this index since September 3, more than any other state we track, and it is also where Jon Husted is defending a Senate seat in a special election. Illinois is up 14.6%. North Carolina, supplied from the Gulf Coast rather than the Midwest, is up 10.5% on the crude move alone and is also home to one of the cycle’s most competitive Senate races. The overlap between where gas prices are rising fastest and where Senate control will actually be decided is not a coincidence of geography. It is Midwest refining capacity sitting directly under several of the most contested seats on the map.
Conclusion
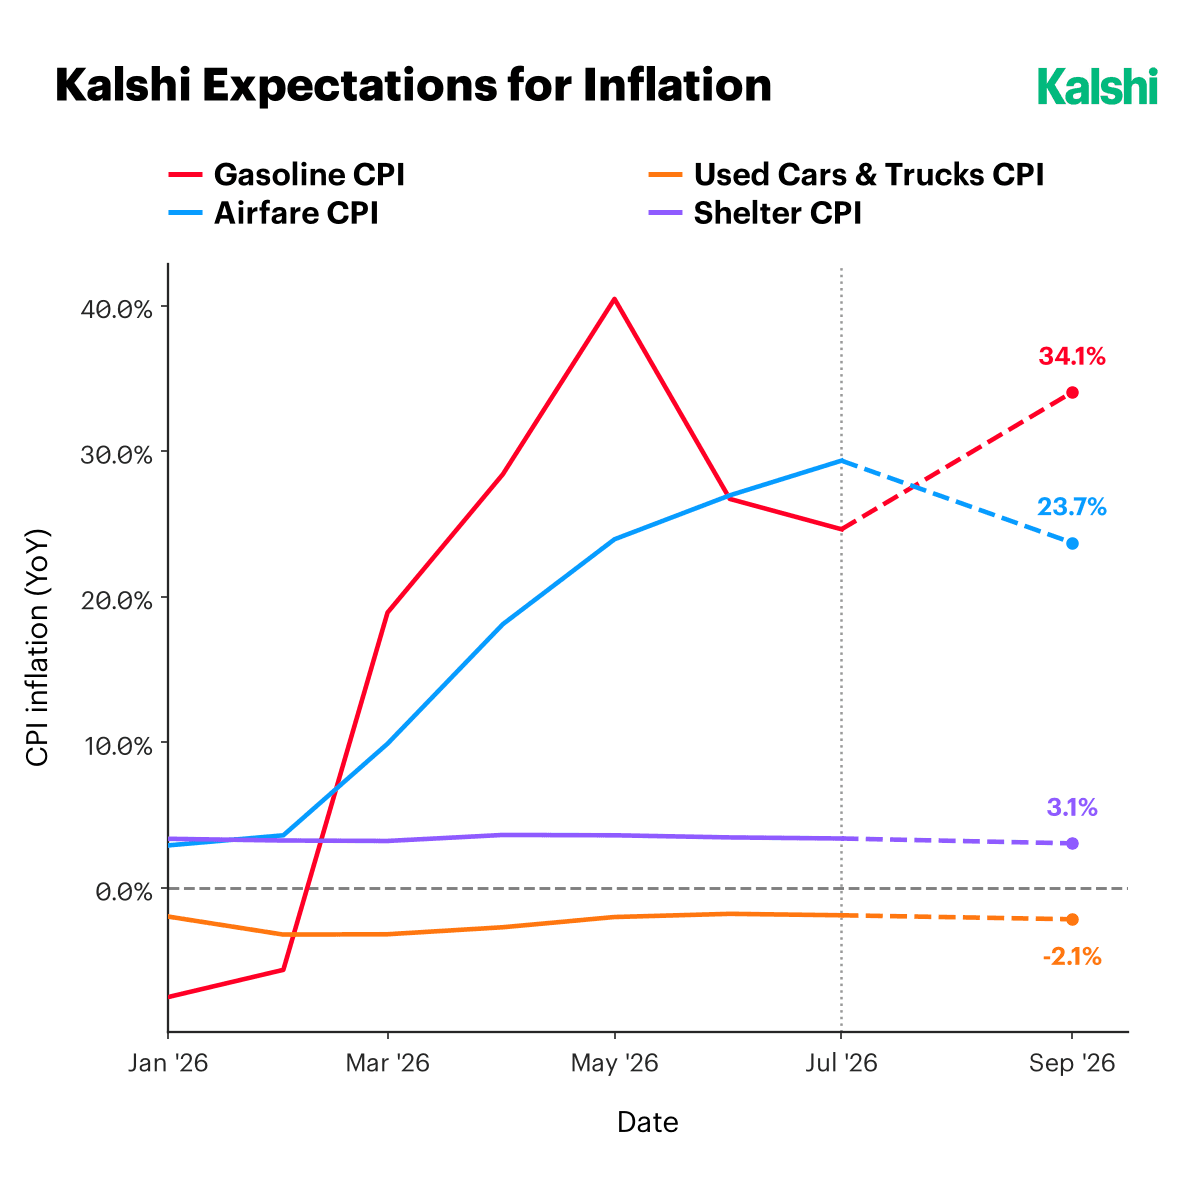
As all eyes fall on the midterm elections in November, the big and emerging sticking point is price at the pump. Without an end in sight to the situation in the Middle East, consumers are pricing in oil being higher for longer, leading both to an increased will for the Fed to tighten rates to curb inflation and consumer spending, and a headache for the Republican party.
About Kalshi Research
Signal-rich analysis of prediction markets. Questions, data access (currently free for institutional clients), or collaboration: research@kalshi.com
Disclaimer
This report is published by Kalshi Inc. (“Kalshi,” “we,” or “us”) for informational and educational purposes only. It is not investment, legal, tax, or trading advice, and it does not constitute a recommendation or solicitation to buy, sell, or hold any event contract, security, or other financial instrument. Nothing in this report creates a fiduciary, advisory, or professional-client relationship between Kalshi and the reader.
Kalshi operates a CFTC-regulated exchange. The event contracts and forward curves referenced herein are traded on or derived from Kalshi’s platform. The market prices, forward curves, and implied probabilities cited in this report reflect what market participants thought at a given moment; such data is subject to change without notice. These figures are not guarantees or predictions of actual outcomes. Past and current prices do not indicate future results. Data sourced from third parties is believed to be reliable but has not been independently verified. Third-party projections and estimates cited herein are subject to significant uncertainty and may not be realized.
Trading event contracts carries risk, including the risk that you may lose some or all of your invested capital. Event contract outcomes are binary and can result in the total loss of the amount paid for a contract. Every figure and probability here is current only as of the date of publication. Kalshi undertakes no obligation to update, revise, or correct this report after publication.
Kalshi, its affiliates, officers, directors, and employees may have financial interests in the contracts or markets discussed herein and may trade them at any time without notice to readers.
This report is not directed at any person in any jurisdiction where its distribution or the offering of event contracts would be contrary to local law or regulation. Before acting on anything in this report, consult your own independent legal, tax, financial, or other professional advisor.
This report is not insurance advice and does not constitute a recommendation regarding the purchase, renewal, or cancellation of any insurance policy or program. Comparisons between event contracts and insurance products are illustrative only and do not account for differences in regulatory protections, counterparty credit risk, claims processes, coverage scope, or policyholder rights that may apply to traditional insurance. Readers should consult a licensed insurance professional before making decisions about their insurance or risk-transfer arrangements.
Get new Kalshi Research publications and insights as they are released.