
September FOMC Meeting Preview: A Hike Is Priced In, But What’s Next?
Published September 15, 2026
Download PDF- A hike is now the base case; and it may not just be one. Kalshi markets price a 25bp increase at 87% as of September 15th, up from roughly 30% on August 27th. Looking out on the forward curve, Kalshi trader positioning has now changed to price another rate increase in December.
- The Fed is priced to tighten into a five-year low in core CPI. Core CPI fell to 2.4% in August, the lowest since March 2021. Core PCE, the gauge Warsh named at Jackson Hole as the one he acts on, is 3.3%. The Committee votes Wednesday with July PCE as its latest read of its own preferred index; August PCE lands on 30 September.
A September Rate Hike Looks All-But-Guaranteed
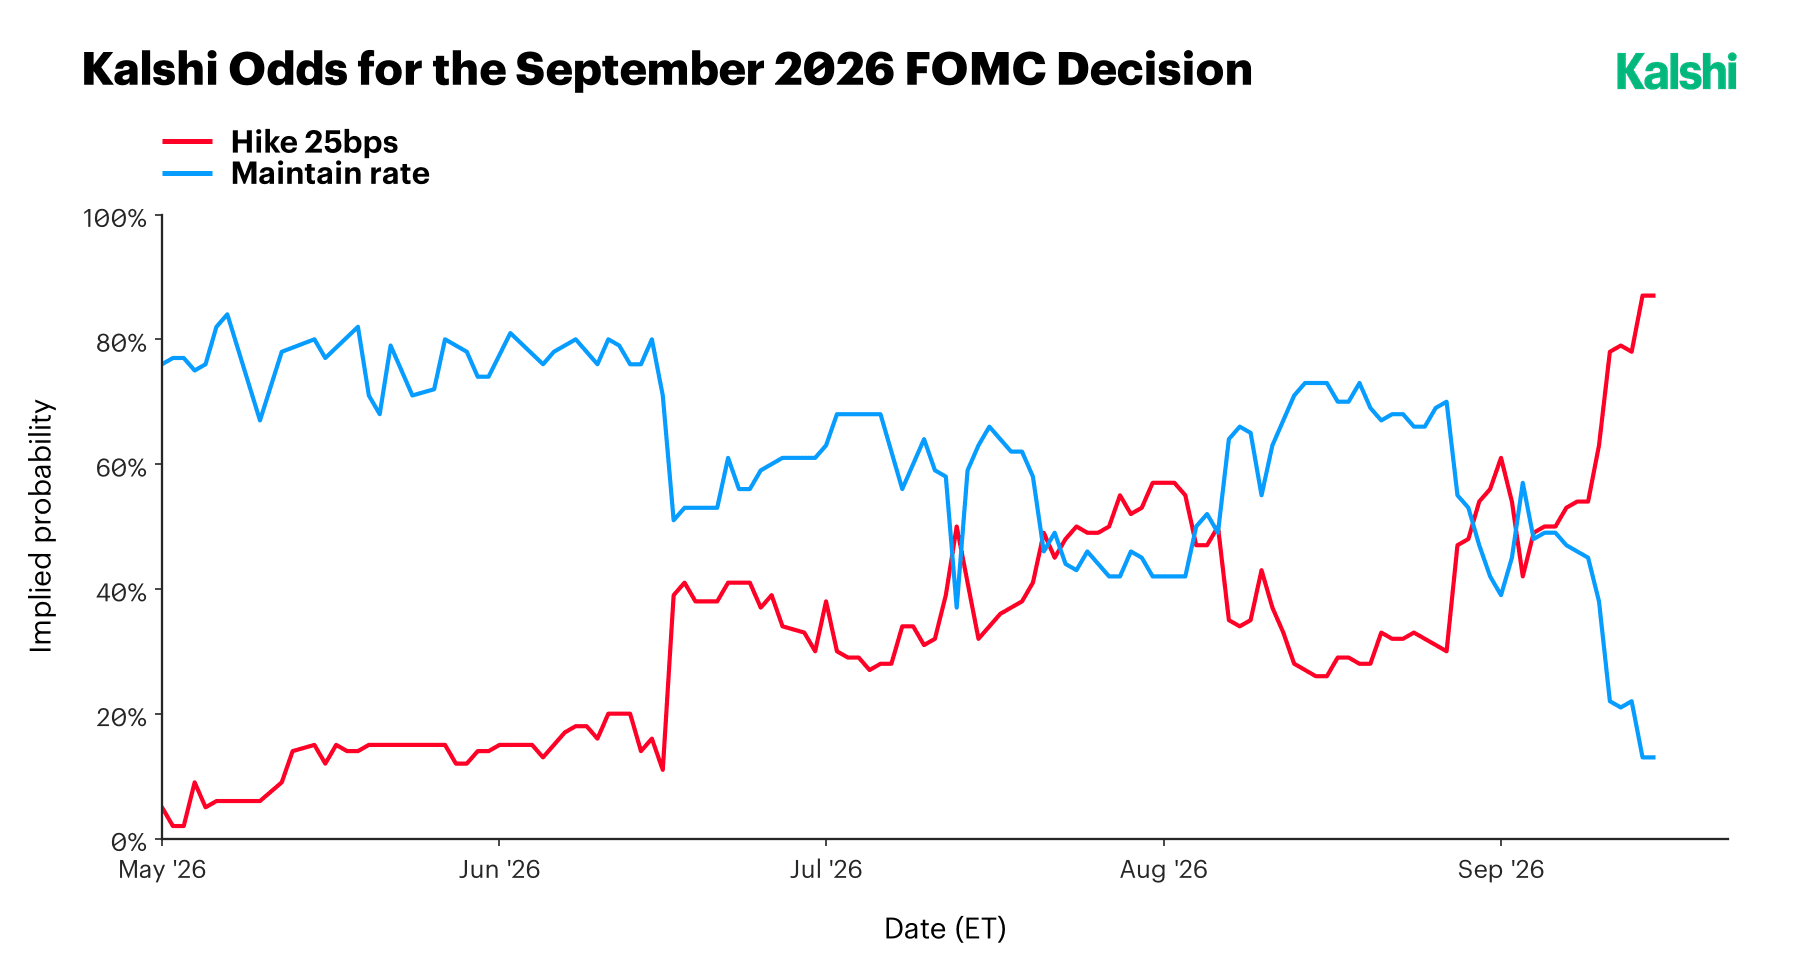
Over $80 million in volume has now been traded on the September FOMC meeting, where market participants now appear to be confidently calling a rate hike all-but-guaranteed. This repricing traces to four key developments:
The first is Chair Warsh himself. His Jackson Hole speech on August 28th, his first as Chair at the Symposium, was read by markets as unambiguously hawkish even though he declined to signal a specific move. He told the audience:
“The Fed’s price-stability objective of 2 percent, as measured by the personal consumption expenditures (PCE) price index, is a firm, fixed target. Let’s be equally clear about another aspect of the objective: Price stability is not self-executing, nor is inflation necessarily mean-reverting. It is the Fed’s job to deliver stable prices.”
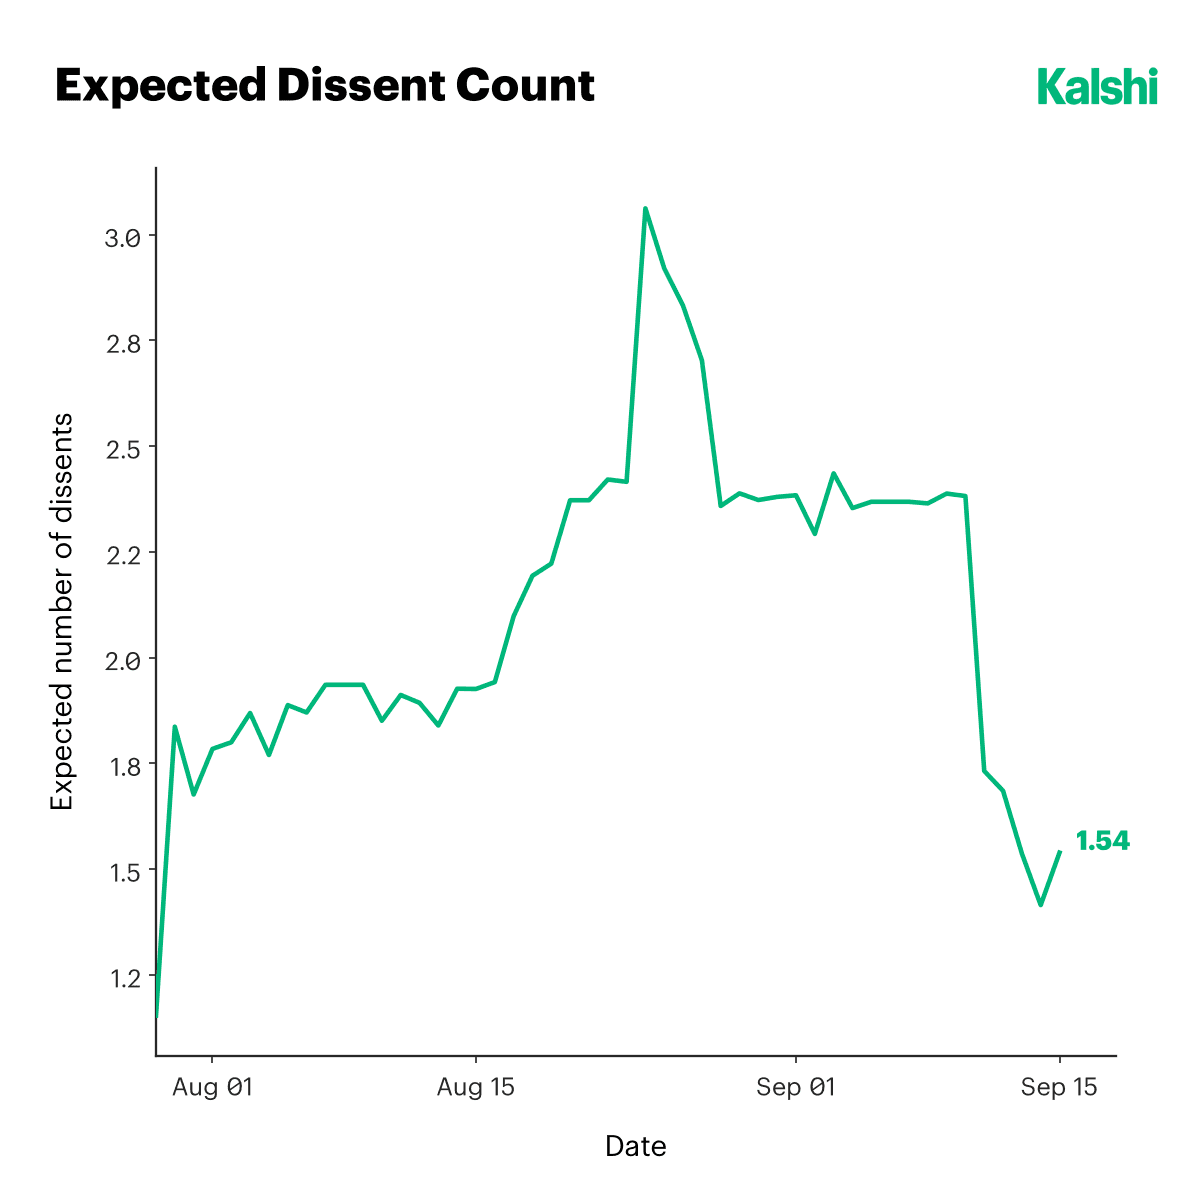
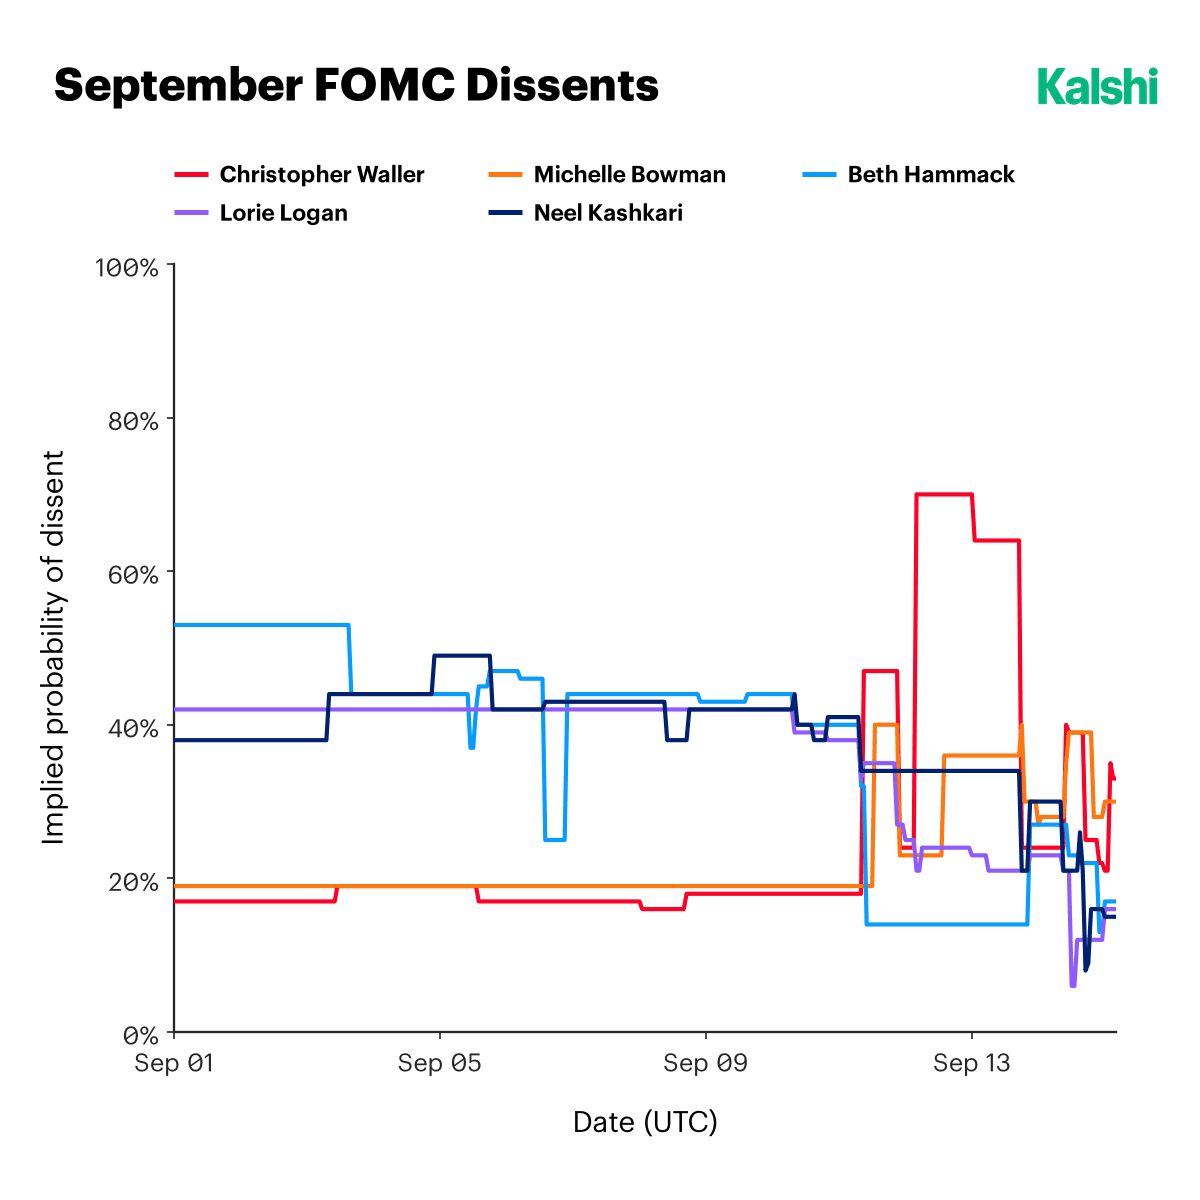
He added that the Committee needed to see underlying inflation moving toward target “clearly and at sufficient speed,” and that this summer’s better inflation readings did not yet show that. Markets read the speech as a floor under hawkishness rather than a specific signal: implied hike odds moved from about one in three beforehand to above 50% within hours, and have climbed further since. As the probability of a hike has increased, the probability of dissent at the meeting has fallen – noting 3 at the last, with Christopher Waller and Michelle Bowman priced as the two likeliest dissenters.
The second is the data itself. August’s jobs report, released September 4, showed nonfarm payrolls up 162,000, nearly three times the 53,000 consensus estimate. The unemployment rate held at 4.1%. A week later, the August CPI report showed headline inflation up 0.4% for the month and 3.4% year over year, both in line with expectations, but core CPI rose 0.3% on the month, a tenth of a point hotter than forecast. Neither report gave the Fed cover to hold, and both are consistent with the tailwind that AI-linked capital spending has provided to construction, utilities, and services employment even as manufacturing and information-sector hiring have been softer.
The third is the on-again, off-again conflict in Iran, covered in more detail below. A resumption of fighting around the Strait of Hormuz since early July has pushed WTI crude from roughly $68 a barrel to above $100, and that volatility is feeding directly into the inflation data discussed above, leaving the Fed less room to treat energy price moves as transitory.
The fourth, and arguably the most structural of the four, is a bond market that has begun pricing concerns about U.S. fiscal credibility that have nothing to do with the FOMC’s calendar. The mechanism is uncomfortable but familiar: when investors start doubting a government’s capacity or willingness to control its own borrowing, they demand a higher term premium to keep lending to it, and a central bank that looks reluctant to defend price stability in that environment risks being read as tacitly accommodating the problem rather than fighting it, which only cheapens the currency and steepens the curve further. That is the backdrop Chair Warsh inherits. Total U.S. public debt crossed $40 trillion on August 18 and stood at just over $40.09 trillion as of September 4, more than double its level a decade ago, against a deficit on pace to run near $1.9 trillion this fiscal year, or roughly 6% of GDP.
The 30-year Treasury yield touched roughly 5.34% in August, its highest level since 2007, pushing the Treasury to expand its long-end bond buybacks. Some of that pressure is fiscal, but some of it is new competition for lenders’ dollars: hyperscalers financing the AI buildout have issued well over $100 billion in corporate bonds over the past year, including Meta’s record $30 billion investment-grade deal and more than $85 billion raised by Alphabet across six currencies, with dealers expecting total U.S. corporate issuance to approach record levels again this year. None of that shows up as a line item in Wednesday’s statement, but a Fed seen as slow to act into a bond market this unsettled risks compounding the very credibility problem it is trying to solve, which is one more reason the path of least resistance now runs toward a hike rather than away from one.
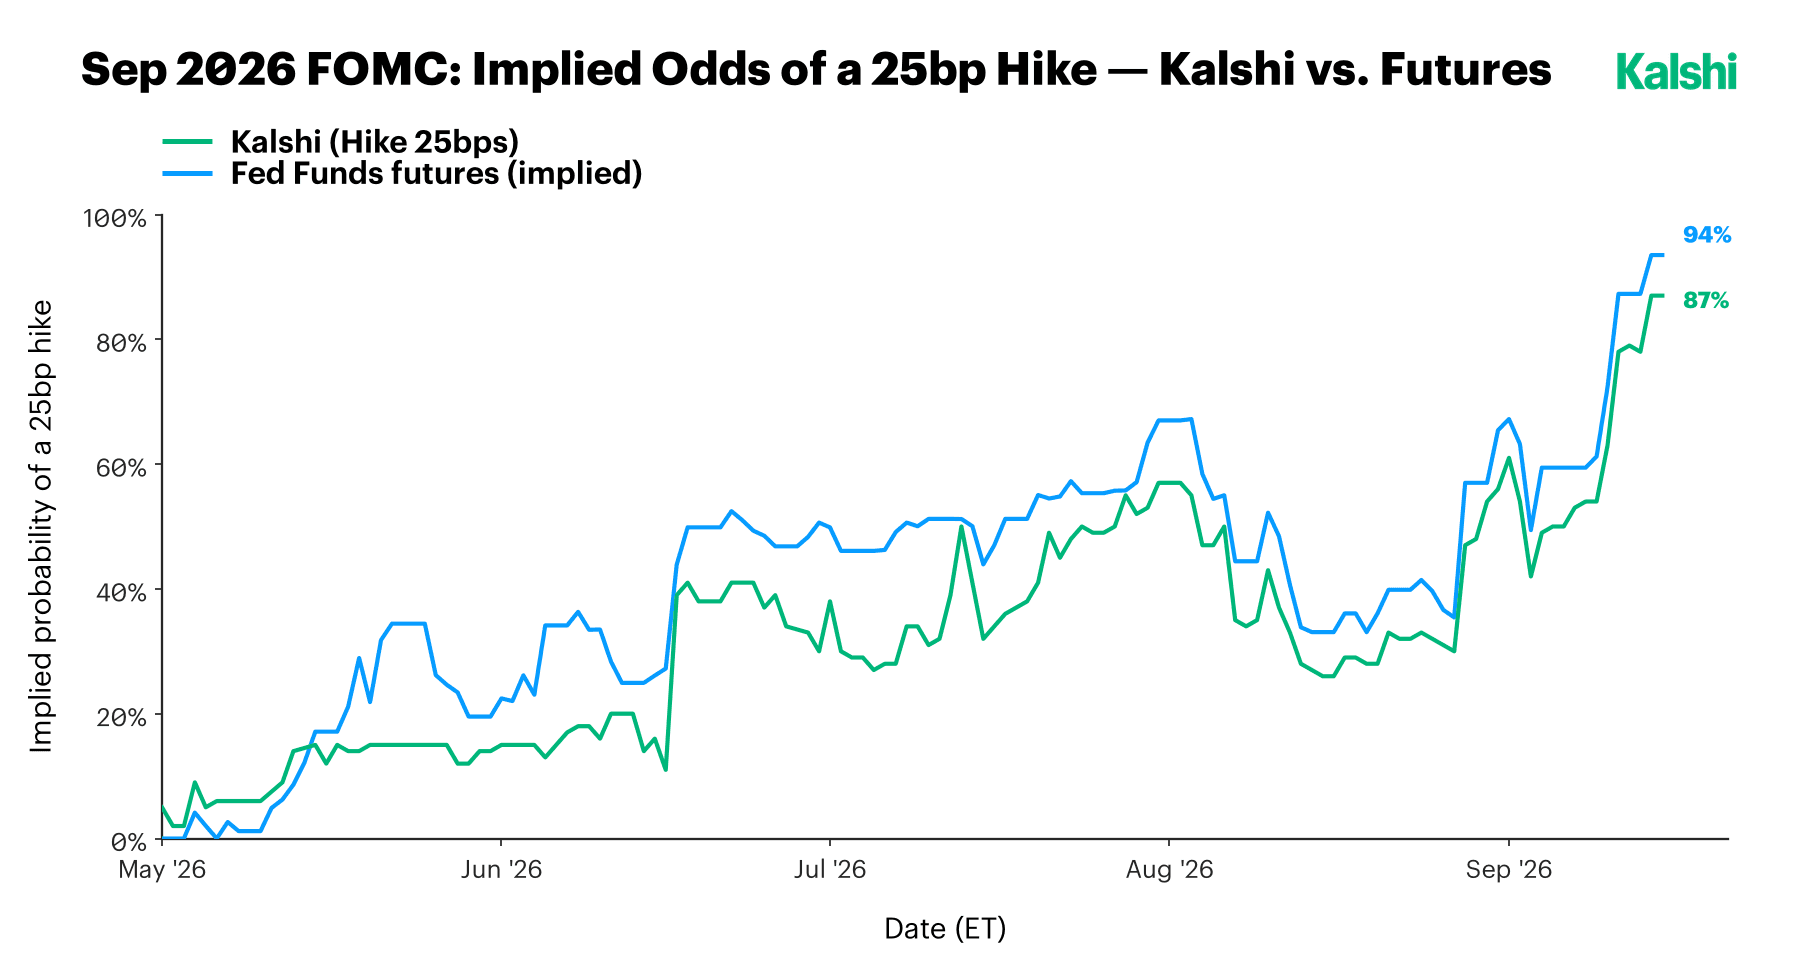
Kalshi’s pricing and Fed funds futures have moved in close step through this repricing, though futures have consistently run a touch hotter. As of September 15, Fed funds futures imply a 94% probability of a hike, roughly seven points above Kalshi’s own 87%. The two series diverged most sharply in early August, when the initial (later-revised) July payrolls miss pulled both measures down together before the stronger August data reversed the move.
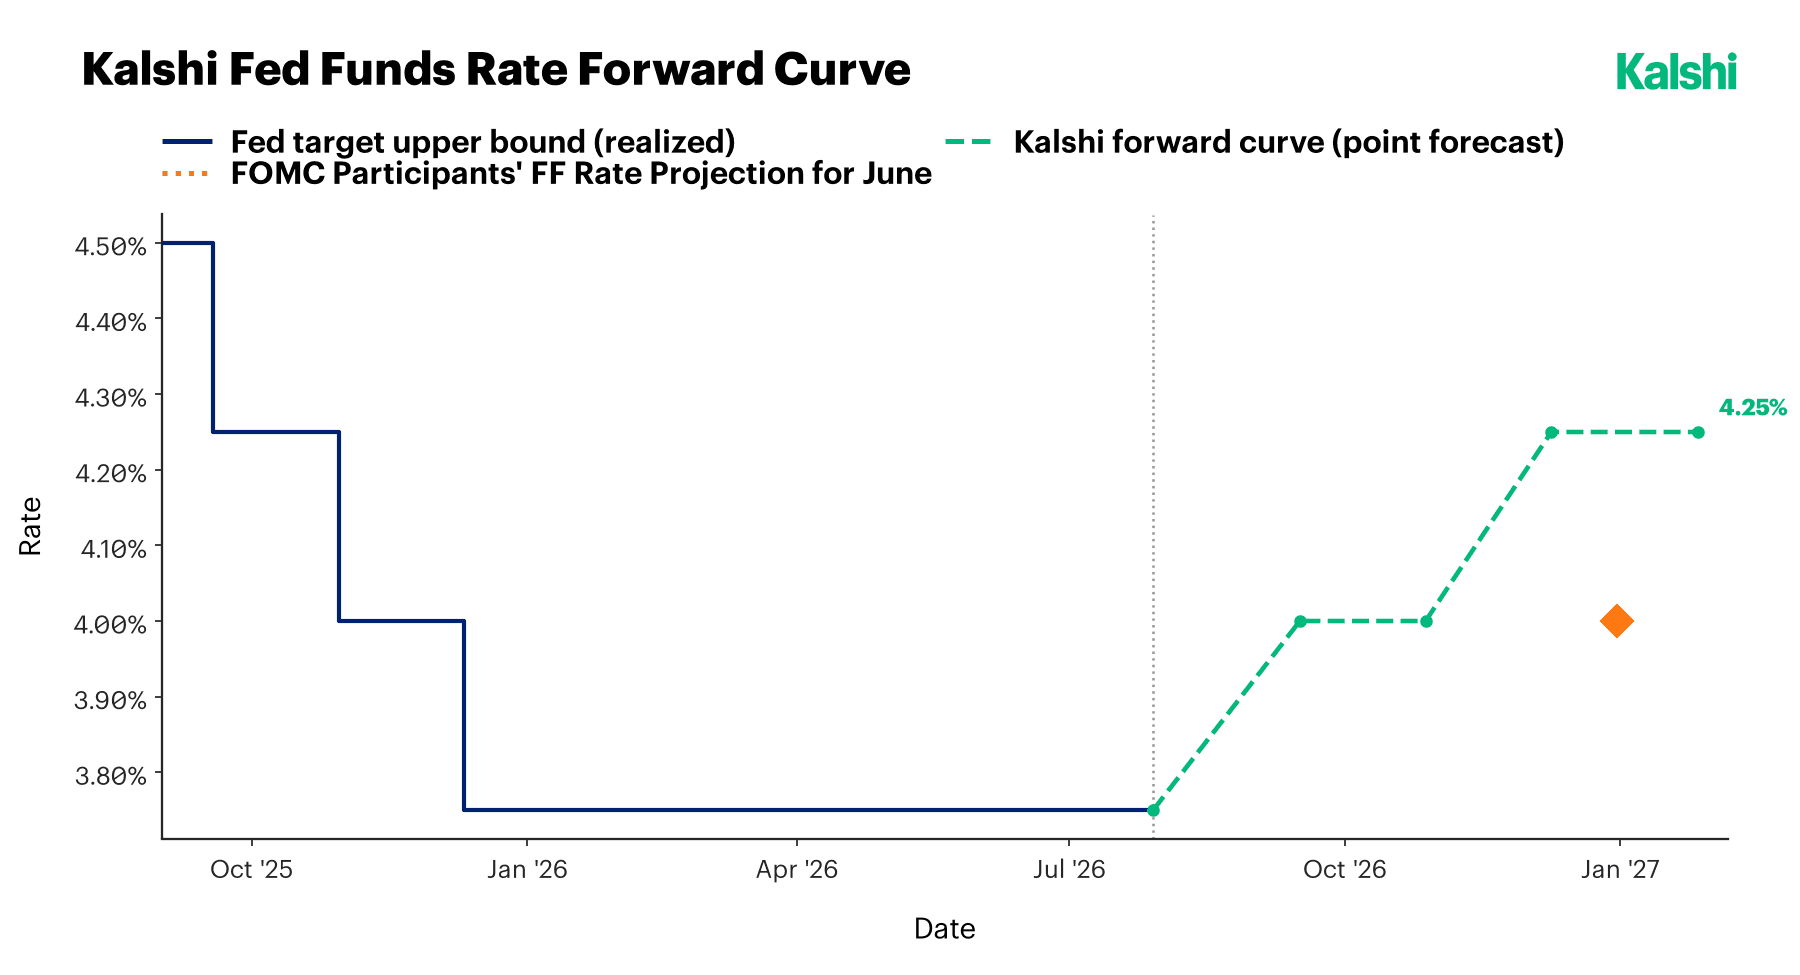
Kalshi’s forward curve has moved from pricing a single hike this year to pricing two: Wednesday’s expected move to a 3.75% to 4.00% target range, then a second quarter-point hike at the Committee’s final meeting of the year on December 8 and 9, taking the upper bound to 4.25%. That is a full move beyond where the Fed’s own Summary of Economic Projections left off in June, when the median participant’s year-end estimate implied just one hike, to a 3.75% to 4.00% range, with 9 of 18 participants penciling in at least one increase against 8 who saw no change and one who still expected a cut. Wednesday’s meeting brings a fresh set of projections – the Committee’s first update since the energy shock intensified over the summer.
New Kalshi Research, straight to your inbox.
Inflation Continues To Run Hot, And Underlying Economic Conditions Look Resilient
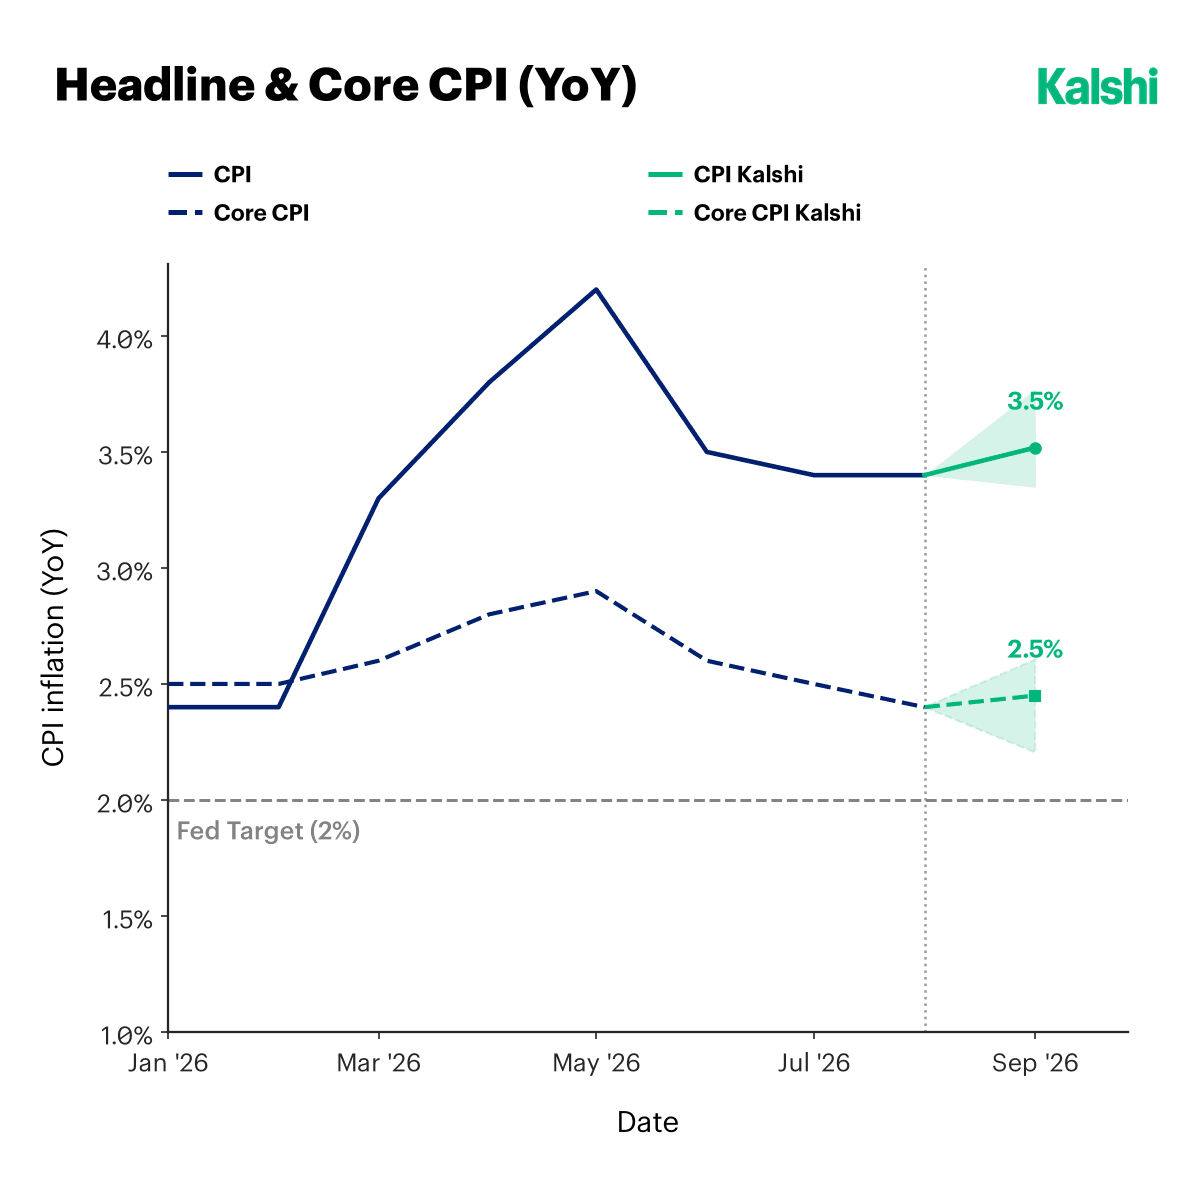
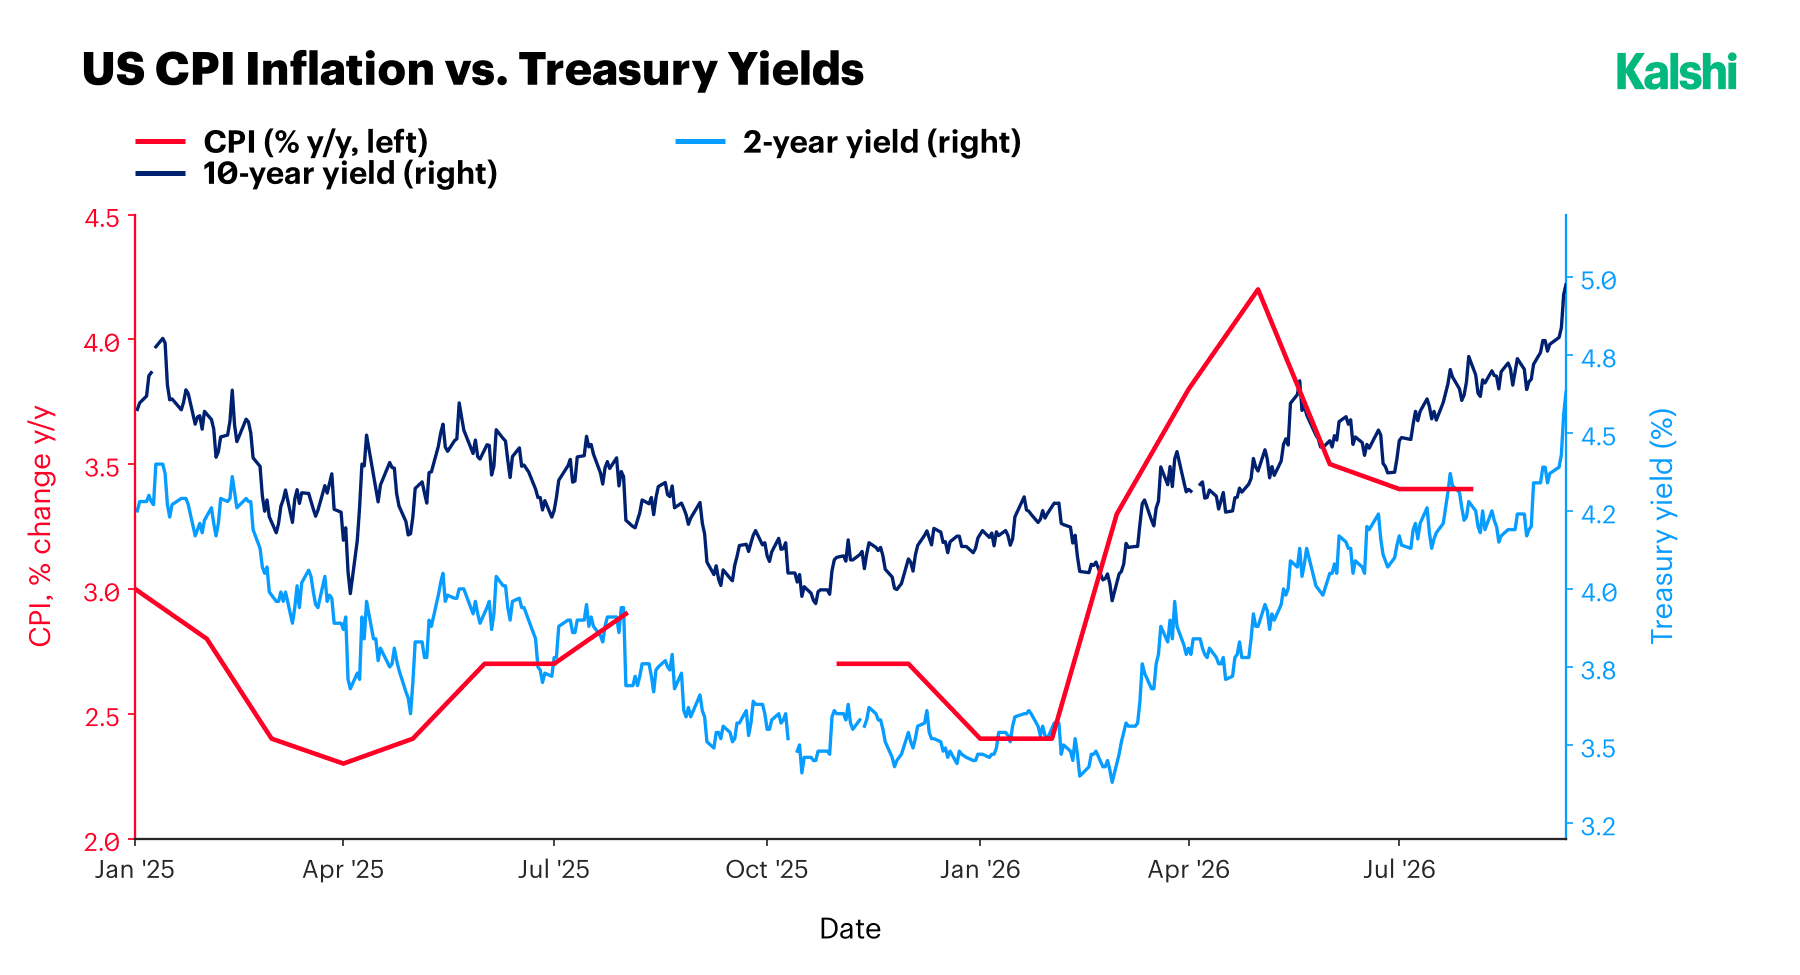
The headline CPI story since January has been almost entirely a gasoline story, an echo of the dynamic Kalshi Research flagged ahead of the August 12 report. Headline inflation climbed from 2.4% in January to a 4.2% peak in May before June’s sharp energy-driven pullback, and it has since held at 3.4% for two straight months. Gasoline did most of both the climbing and the settling: the pump index rose 3.9% in August alone, accounting for more than a third of that month’s entire headline increase, and prices are still up 27.4% from a year ago given how far gas prices had fallen in 2025. Core CPI has told a gentler story, easing to 2.4% in August, its lowest reading since March 2021, as shelter and services inflation cooled at the margin.
The trouble for anyone reading core CPI as a green light is that it is not the number the Fed says it is watching. Core PCE, the measure Chair Warsh singled out by name at Jackson Hole as the Fed’s operative target, stood at 3.3% year over year in the Committee’s most recent read, for July, alongside a 3.7% headline PCE figure; both were a tenth of a point above consensus when reported on August 26. Wednesday’s vote happens with that July print as the latest available data. August’s PCE report, which will show whether the softer core CPI trend is showing up in the Fed’s preferred gauge, does not land until September 30, two weeks after the decision.
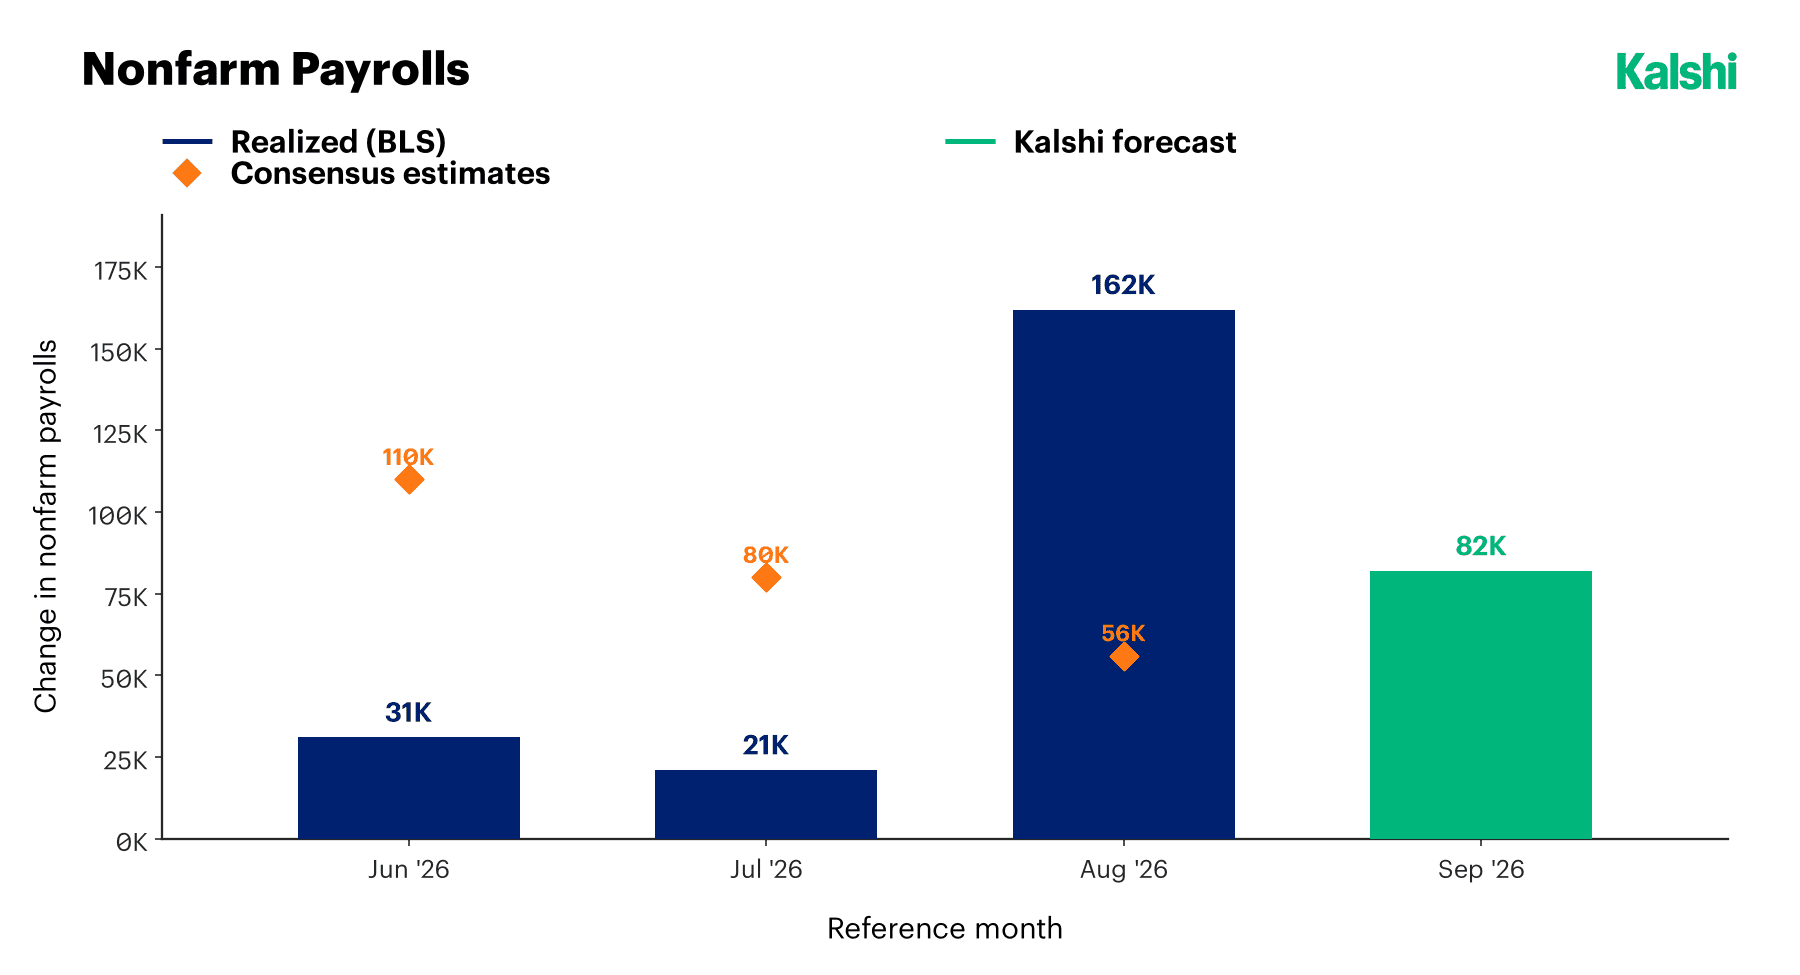
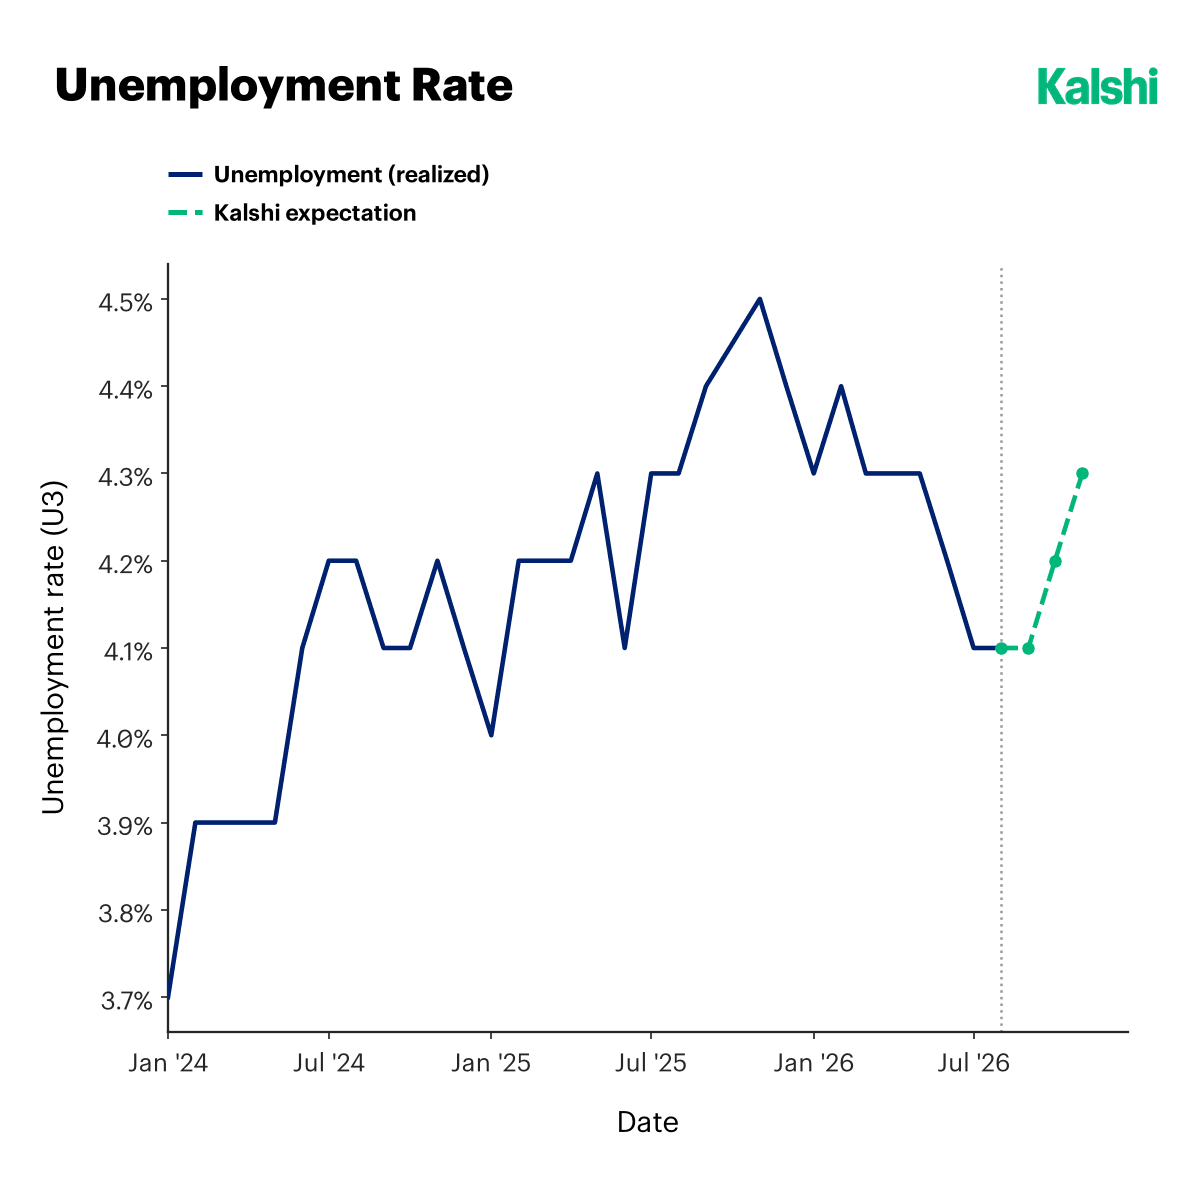
The labor market gave the Committee even less reason to wait. Nonfarm payrolls reported the strongest monthly gain in five months, and the report also revised June and July higher by a combined 55,000. The unemployment rate held at 4.1% for a second straight month, average hourly earnings rose 3.1% year over year, and labor force participation ticked up to 61.6%. None of that is the profile of a labor market that needs protecting from higher rates.
Additionally, the traditional approach to macroeconomic flowthrough of rates appears to be stalled – many homeowners, who would be hit via mortgage payments, have fixed rates over the COVID-period, making them effectively immune. The earliest signs to crack them would be spending tied to inflation-affected categories, such as transit etc.
Non-farm payrolls came in significantly above expectations. While likely a reflection of seasonality, it is still important to note that the labour market is still yet to show significant signs of cracking.
Kalshi’s own labor-market contracts treat the current calm as more likely to be a plateau than a floor: the unemployment rate has held at 4.1% since July, but Kalshi’s forward pricing points to a drift higher, toward 4.3%, later in the year, a reminder that the current stability coexists with a labor market that has been gradually cooling since its 2024 low near 3.9%. That said, these longer-dated labor-market contracts trade in far lower volume than the FOMC contract itself and deserve proportionally less weight than Wednesday’s decision.
Part of why the traditional transmission channel from rates to households has been slower to bite is structural. A large share of homeowners locked in fixed mortgage rates during the 2020 to 2021 period and remain largely insulated from higher borrowing costs regardless of where the Fed sets its target range. The clearer channel runs instead through categories directly exposed to energy and freight costs, where the Iran-driven price shock discussed below is the more immediate transmission mechanism. Meanwhile, AI-linked capital spending, projected at roughly $725 billion across the four largest hyperscalers this year alone, has provided an offsetting tailwind to construction, utilities, and specialized services employment that has helped keep the aggregate numbers resilient even as manufacturing and information-sector hiring have softened.
Enjoying this? Get our next piece of research as soon as it's out.
The Iran Crisis Is Keeping Investors on Notice
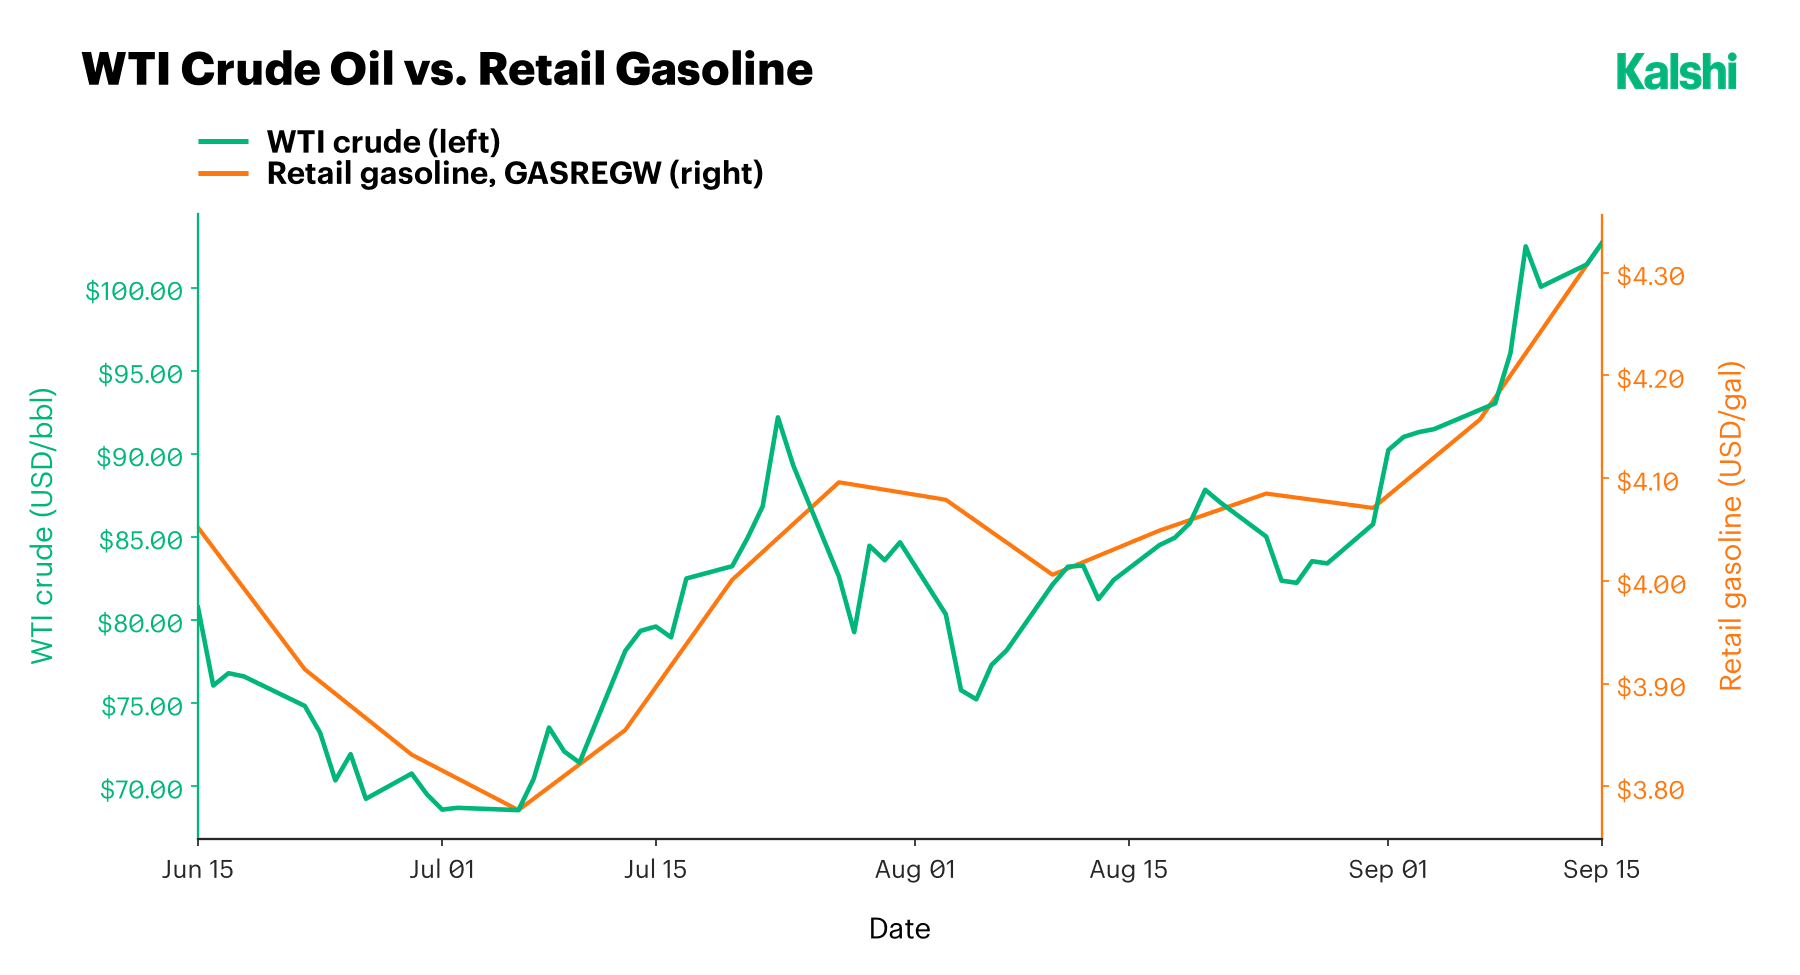
WTI crude has climbed from roughly $68 a barrel in early July to above $100 in the run-up to Wednesday’s decision, touching a four-month high last week before settling back to roughly $102 to $103. The proximate cause is a resumption of fighting around the Strait of Hormuz after a June ceasefire briefly returned oil to pre-war levels: strikes on Iranian tankers and on Saudi Arabia’s Jizan refining complex in early September pushed prices to their highest since the conflict first erupted in late February. That volatility is feeding directly into the inflation data discussed above and leaves the Fed less room to treat energy price moves as transitory, particularly with national average gasoline prices back above $4 a gallon. Per the chart above – retail gas prices are moving in lockstep with their WTI crude counterpart. Though not directly affected by Fed decisions, a “higher for longer” narrative could prove to be dangerous given the immense national debt – continuing to hit Treasury borrowing costs.
All Together Now
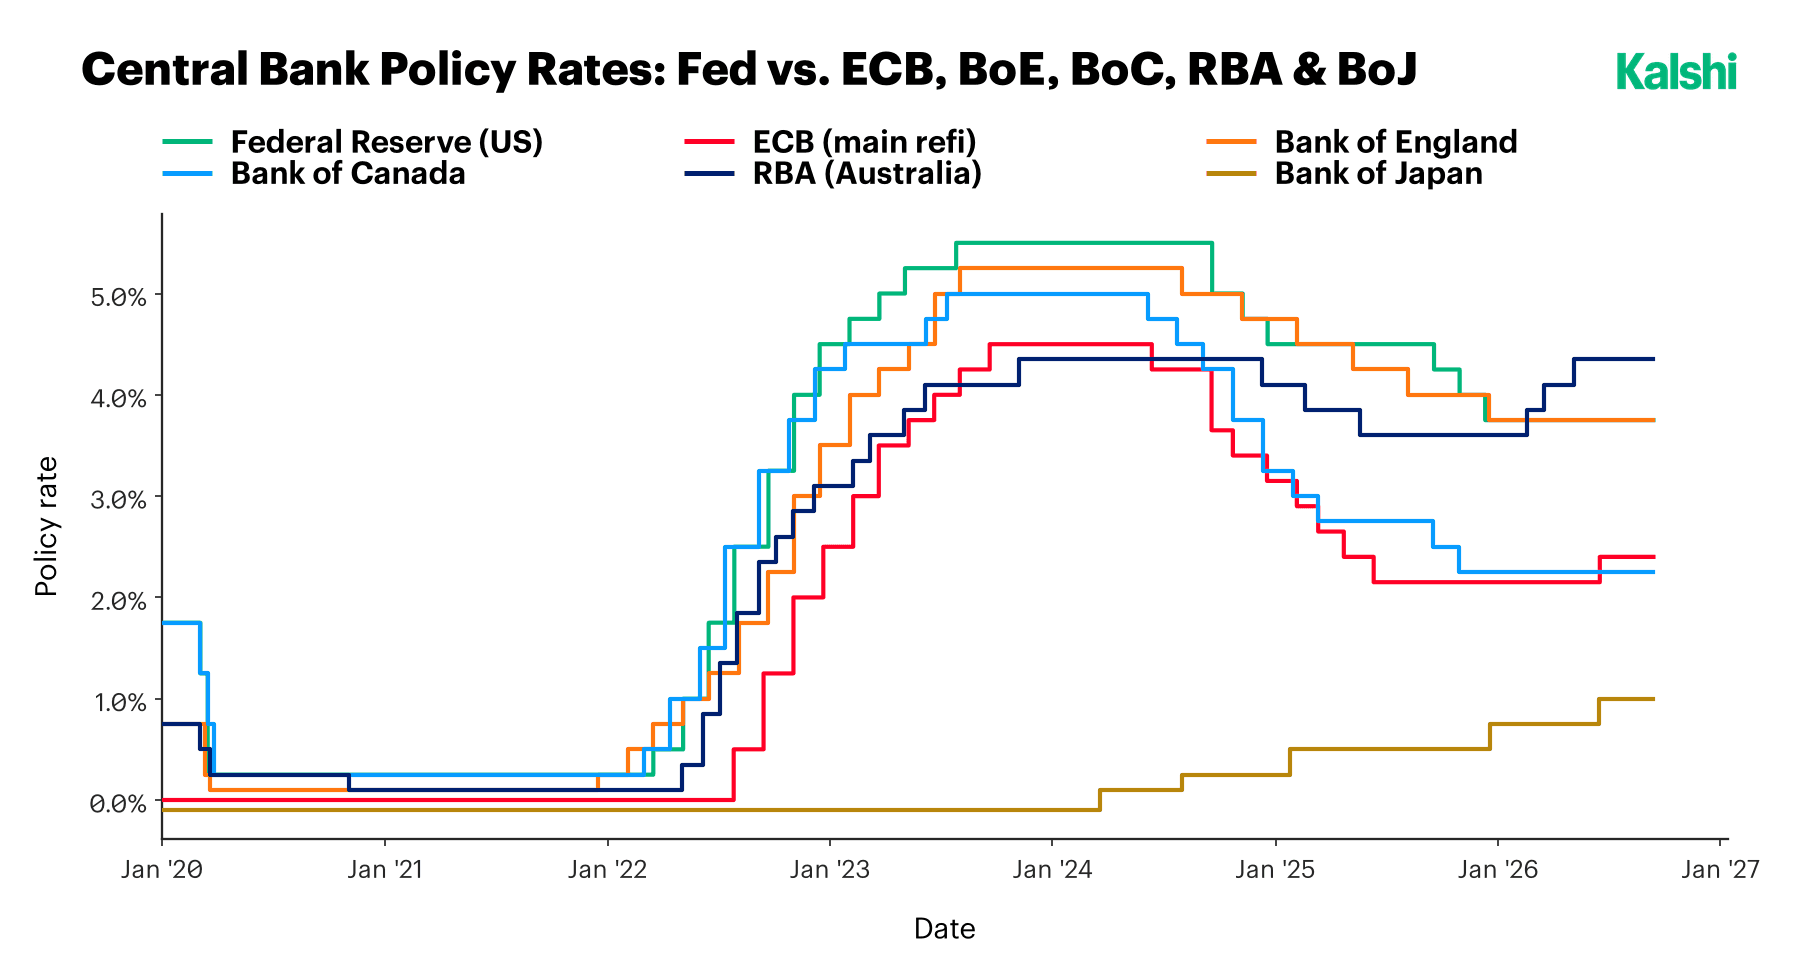
The United States is not tightening in isolation. The European Central Bank raised its key rates by 25 basis points on September 10, moving the deposit facility rate to 2.50% (and the main refinancing rate to 2.65%) effective September 16, after euro area inflation accelerated to 3.3% in August on a 14.3% jump in energy prices; President Lagarde called the decision unanimous while stressing the Council was not committing to a path. The Bank of Japan is widely expected to raise its policy rate to 1.25% at the conclusion of its meeting on Friday, September 18, the first time in this tightening cycle that a BoJ decision has landed in the same week as a Fed decision, a coincidence that has raised its own concerns about a disorderly unwind of yen-funded carry trades if the two banks’ paths diverge from what is currently priced. Board member Hajime Takata has already dissented twice this year in favor of moving faster. The Reserve Bank of Australia meets next on September 28 and 29; annual inflation eased to 3.5% in July, but trimmed-mean inflation, the RBA’s preferred underlying measure, has held at 3.6%, and forecasters at National Australia Bank now expect a quarter-point hike to 4.60%.
Brazil remains the outlier, with the Selic still in easing mode as its own inflation and activity data cool. The common thread among the hikers, as we have noted before, is energy exposure: economies that import a large share of what they burn are seeing a weaker currency and higher oil prices compound into a domestic inflation problem larger than the global price alone would suggest.
Conclusion
Wednesday’s decision will not be the last word on this cycle. The Committee’s new Summary of Economic Projections, released alongside the statement, will show whether its own dot plot has moved to meet a market that has already priced a second hike for December, and Chair Warsh’s press conference, following his now-established preference for saying less rather than more, will likely leave markets to infer the rest from the dissent count and the dots themselves. Minutes from the meeting are not due for three weeks.
The next FOMC meeting, on October 27 and 28, does not include a new Summary of Economic Projections, which leaves December 8 and 9, the final projections release of the year, as the next point at which the Committee’s own view and the market’s will be tested against each other directly. Separately, July’s minutes revealed that Warsh has floated cutting the Committee’s meeting schedule from eight sessions a year to six, a structural change that, if adopted, would only raise the value of continuously priced markets in the gaps between meetings.
About Kalshi Research
Signal-rich analysis of prediction markets. Questions, data access (currently free for institutional clients), or collaboration: research@kalshi.com
Disclaimer
This report is published by Kalshi Inc. (“Kalshi,” “we,” or “us”) for informational and educational purposes only. It is not investment, legal, tax, or trading advice, and it does not constitute a recommendation or solicitation to buy, sell, or hold any event contract, security, or other financial instrument. Nothing in this report creates a fiduciary, advisory, or professional-client relationship between Kalshi and the reader.
Kalshi operates a CFTC-regulated exchange. The event contracts and forward curves referenced herein are traded on or derived from Kalshi’s platform. The market prices, forward curves, and implied probabilities cited in this report reflect what market participants thought at a given moment; such data is subject to change without notice. These figures are not guarantees or predictions of actual outcomes. Past and current prices do not indicate future results. Data sourced from third parties is believed to be reliable but has not been independently verified. Third-party projections and estimates cited herein are subject to significant uncertainty and may not be realized.
Trading event contracts carries risk, including the risk that you may lose some or all of your invested capital. Event contract outcomes are binary and can result in the total loss of the amount paid for a contract. Every figure and probability here is current only as of the date of publication. Kalshi undertakes no obligation to update, revise, or correct this report after publication.
Kalshi, its affiliates, officers, directors, and employees may have financial interests in the contracts or markets discussed herein and may trade them at any time without notice to readers.
This report is not directed at any person in any jurisdiction where its distribution or the offering of event contracts would be contrary to local law or regulation. Before acting on anything in this report, consult your own independent legal, tax, financial, or other professional advisor.
This report is not insurance advice and does not constitute a recommendation regarding the purchase, renewal, or cancellation of any insurance policy or program. Comparisons between event contracts and insurance products are illustrative only and do not account for differences in regulatory protections, counterparty credit risk, claims processes, coverage scope, or policyholder rights that may apply to traditional insurance. Readers should consult a licensed insurance professional before making decisions about their insurance or risk-transfer arrangements.
Get new Kalshi Research publications and insights as they are released.