
October FOMC Meeting Preview: A Hold Is Priced In, But What’s Next?
Published October 28, 2026
Download PDF- Heads are turning to December as October is a likely hold. Kalshi markets price a hold at roughly 95% heading into Wednesday, with a 25bp hike at about 5%, down from a peak near 70% in the last days of September. The same markets still carry the upper bound of the target range to 4.25% by the December 8–9 meeting.
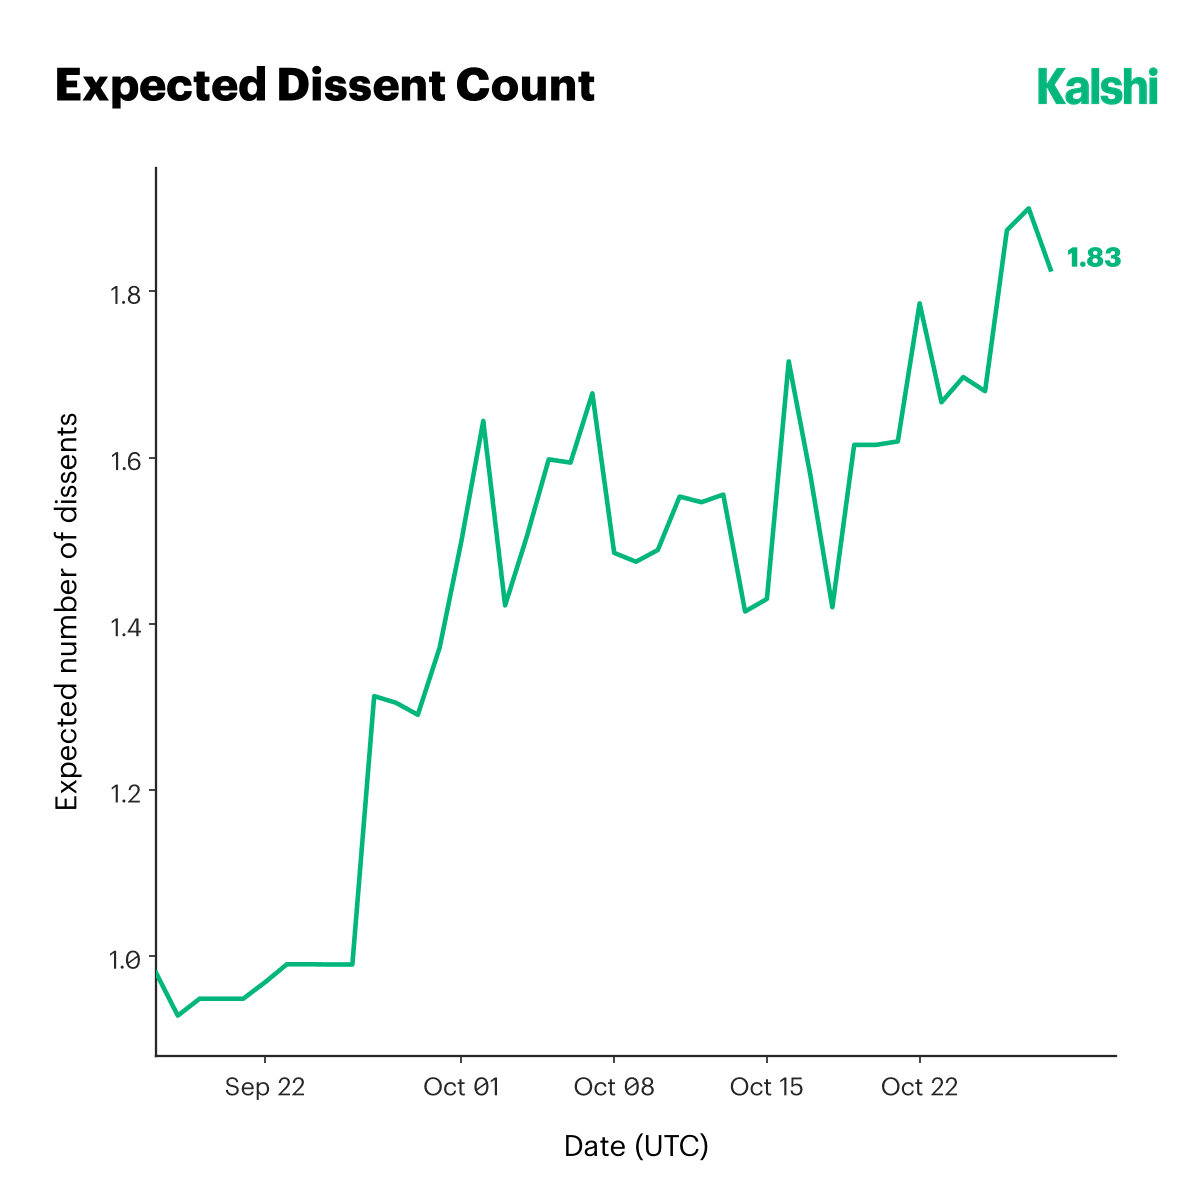
- Two hawkish dissents are expected. Kalshi’s expected dissent count has climbed to 1.83 from just under 1.0 in mid-September, with Cleveland’s Beth Hammack (about 79%) and Dallas’s Lorie Logan (about 68%) the likeliest to vote for a hike.
- Kalshi’s rate path runs well ahead of the Fed’s own dots. The forward curve reaches 5.00% by early 2027, against a September median projection of 4.25% at year-end and no further change through 2027, and it does so as headline CPI re-accelerated to 3.7% while payrolls rose just 29,000.
The Fed raised its target range by 25bp to 3.75% - 4.00% on September 16, its first increase since July 2023, on a unanimous vote. The median projection pointed to one more hike this year, with 16 of 18 participants penciling in at least one, up from 9 of 18 in June. Since then, Chair Warsh’s refusal to offer forward guidance has pushed the market to infer the path from everything except the Chair: data surprises, remarks from his deputies, dissent counts, and the pricing of the markets themselves.
A Hold Is Now Priced at 95%, a Round Trip Engineered Largely by the Fed’s Own Leadership
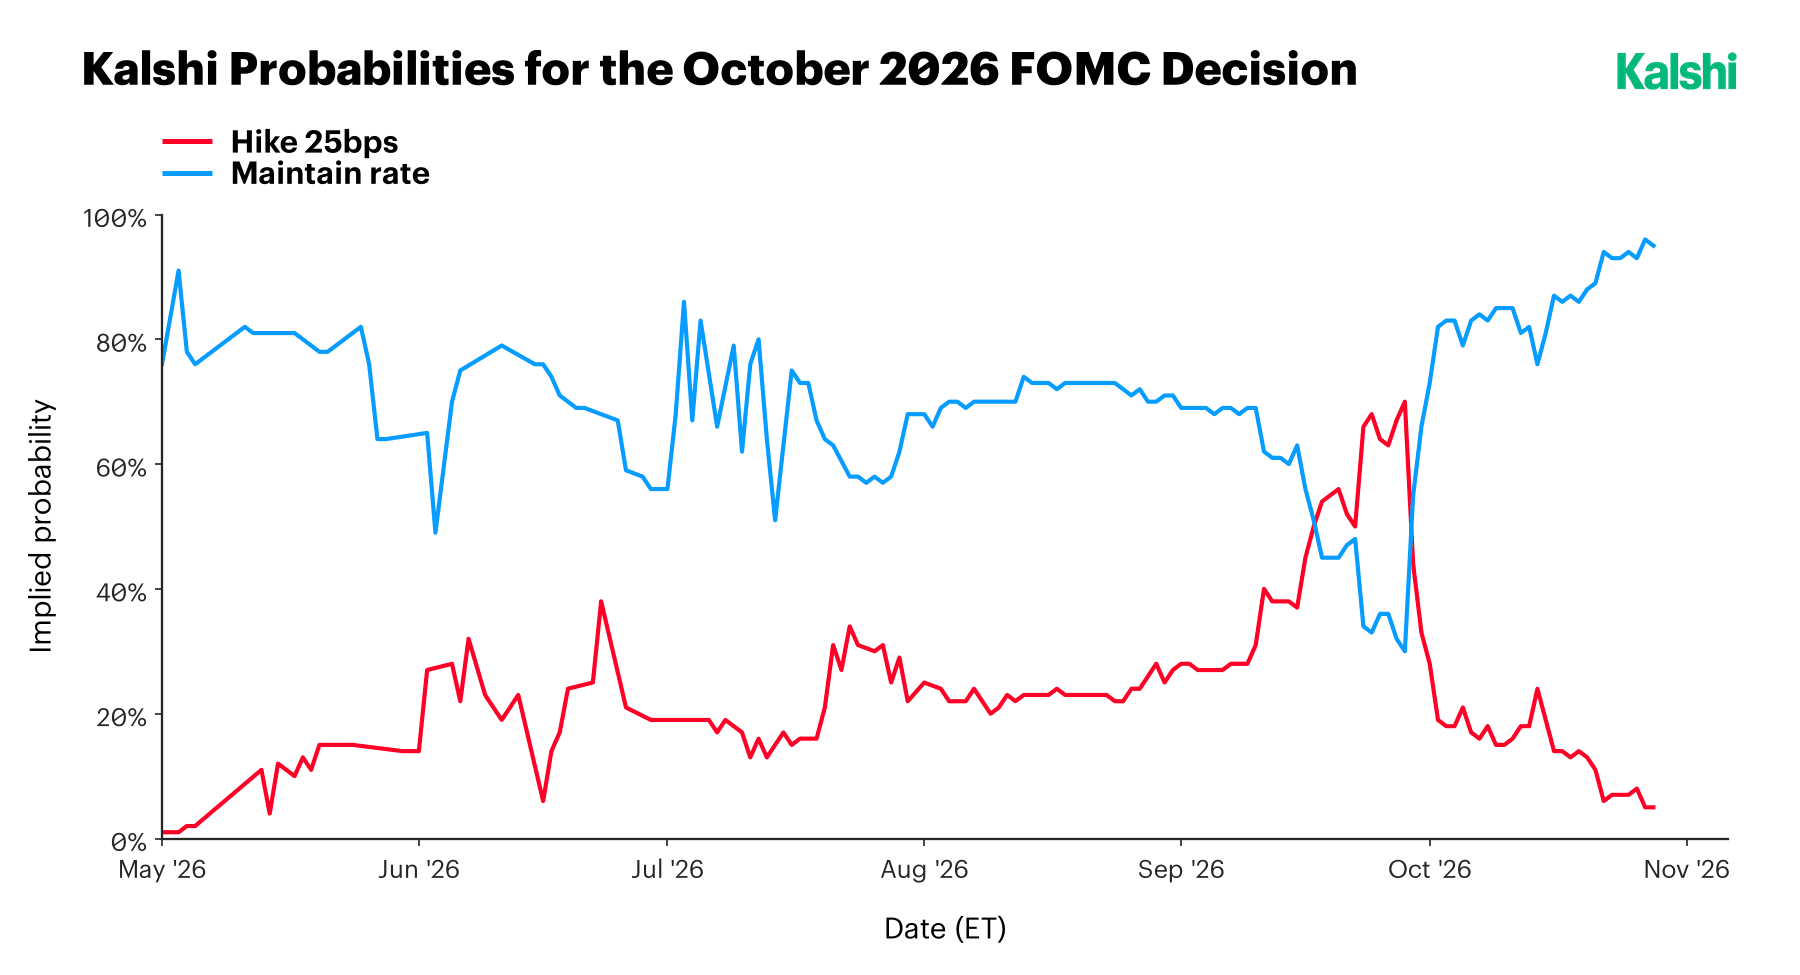
Kalshi’s October contract has completed a full round trip. A 25bp hike was priced at roughly 1% in early May, drifted into a 20–30% range through the summer, and climbed to about 70% in the last days of September, as gasoline pushed toward $4.50 a gallon and the market absorbed the September hike and its hawkish dot plot. It now stands at about 5%, with a hold at about 95%. The reversal traces to four developments, and only two of them were related to the data.
The first is the Fed’s leadership. On September 29, New York Fed President John Williams, the FOMC’s vice chair, signaled there was no urgency to move again, while keeping December in play, and Vice Chair Philip Jefferson was reported to have echoed the message the next day. With Chair Warsh, the three form the informal leadership group whose views the Committee’s majority has tended to follow, so patience from two of the three carries weight that a regional president’s hawkishness does not. Kalshi’s hike probability fell from about 70% to the mid-40s within a day and to the low 30s by October 1.
The second is the data. Also on September 30, the Fed’s preferred gauge came in cooler than expected: core PCE rose 3.0% year over year in August, down from 3.3% in July. Two days later, September payrolls rose just 29,000 against a consensus of 90,000, and the unemployment rate rose to 4.2%. By October 5, Kalshi priced a hike at roughly 20%.
The third is a counterpunch that did not land. September CPI on October 14 was hotter than expected, with headline at 3.7% against 3.6% and core at 2.6% against 2.5%. Kalshi’s hike probability ticked up to roughly 24% and futures-implied odds to roughly a third, but the move reversed within days.
The fourth is Warsh himself. Speaking at the IMF meetings in Bangkok late on October 15 Eastern, his last public remarks before the pre-meeting blackout, he declined to prejudge either meeting.
He added that the world had broadly conformed to the Fed’s expectations since September and named October and December as the meetings at which the Committee will take stock. Futures-implied odds of an October hike fell from about 27% to under 15% on the remarks. A Chair who will not preview a decision is, in practice, previewing that he does not intend to surprise. Causality here is inferential: several of these events landed within the same few days, and the data cannot cleanly separate their effects.
But a Hold Is Not a Consensus: The Committee Is Priced for Two Hawkish Dissents
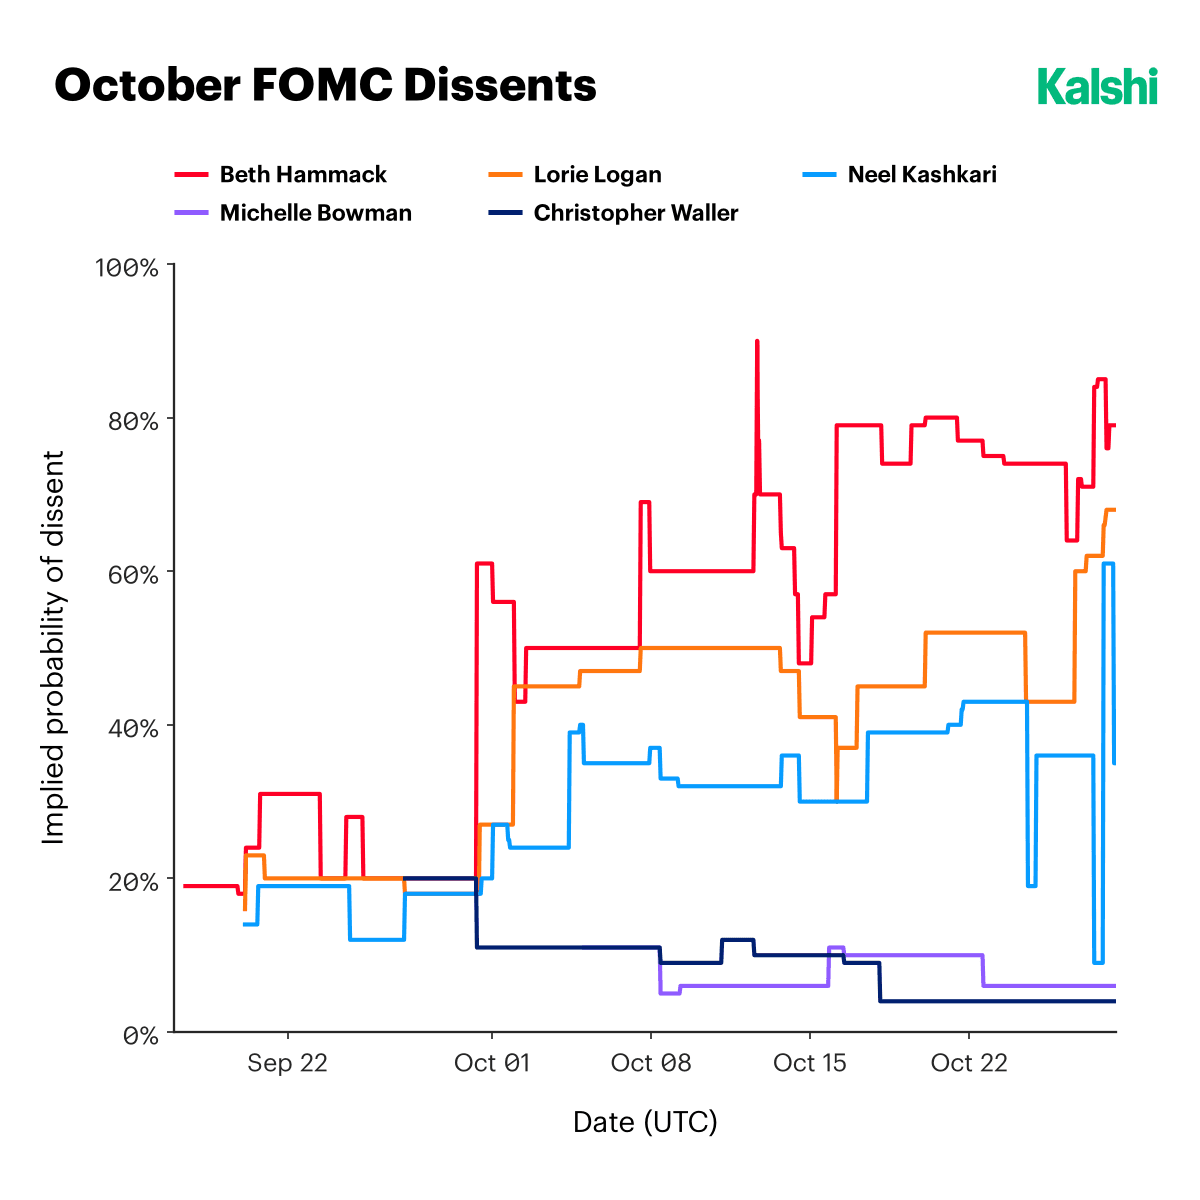
Dissent prices follow a simple logic: a voter dissents when the decision sits far enough from the rate they prefer. In September, with the decision a hike, our contracts priced Christopher Waller and Michelle Bowman as the likeliest dissenters, the members most inclined to wait. Neither dissented, and the vote was unanimous. With the decision now a hold, the gap runs the other way, and the voters furthest from it are the regional presidents who have argued for tighter policy all year.
That is what the charts show. The expected dissent count has risen to 1.83 from just under 1.0 in mid-September, and the individual contracts have sorted themselves by hawkishness: Hammack at roughly 79%, Logan at roughly 68%, Minneapolis’s Neel Kashkari near 35%, and Bowman and Waller in the mid-single digits. Hammack, Kashkari and Logan voted for a hike in July’s 9–3 hold and had dissented in April against the statement’s easing-bias language; they did not dissent in June, nor in September, when the Committee moved to meet them. They are three of this year’s four rotating regional voters, alongside Philadelphia’s Anna Paulson. Warsh has described this kind of disagreement as a feature of the Committee’s design rather than a failure of it.
Two hawkish dissents on a hold would look like July again, with a more consequential subtext: July’s dissenters were arguing the Fed should start tightening, while October’s would be arguing it should not pause. One caveat belongs on the chart. Individual-voter contracts trade at far lower volume than the decision contract itself, and Kashkari’s line swung from under 10% to above 60% in the final week before settling near 35%, the kind of move a thin book produces. We would weight the aggregate count over any single name.
Bond Yields Have Not Waited for the Fed
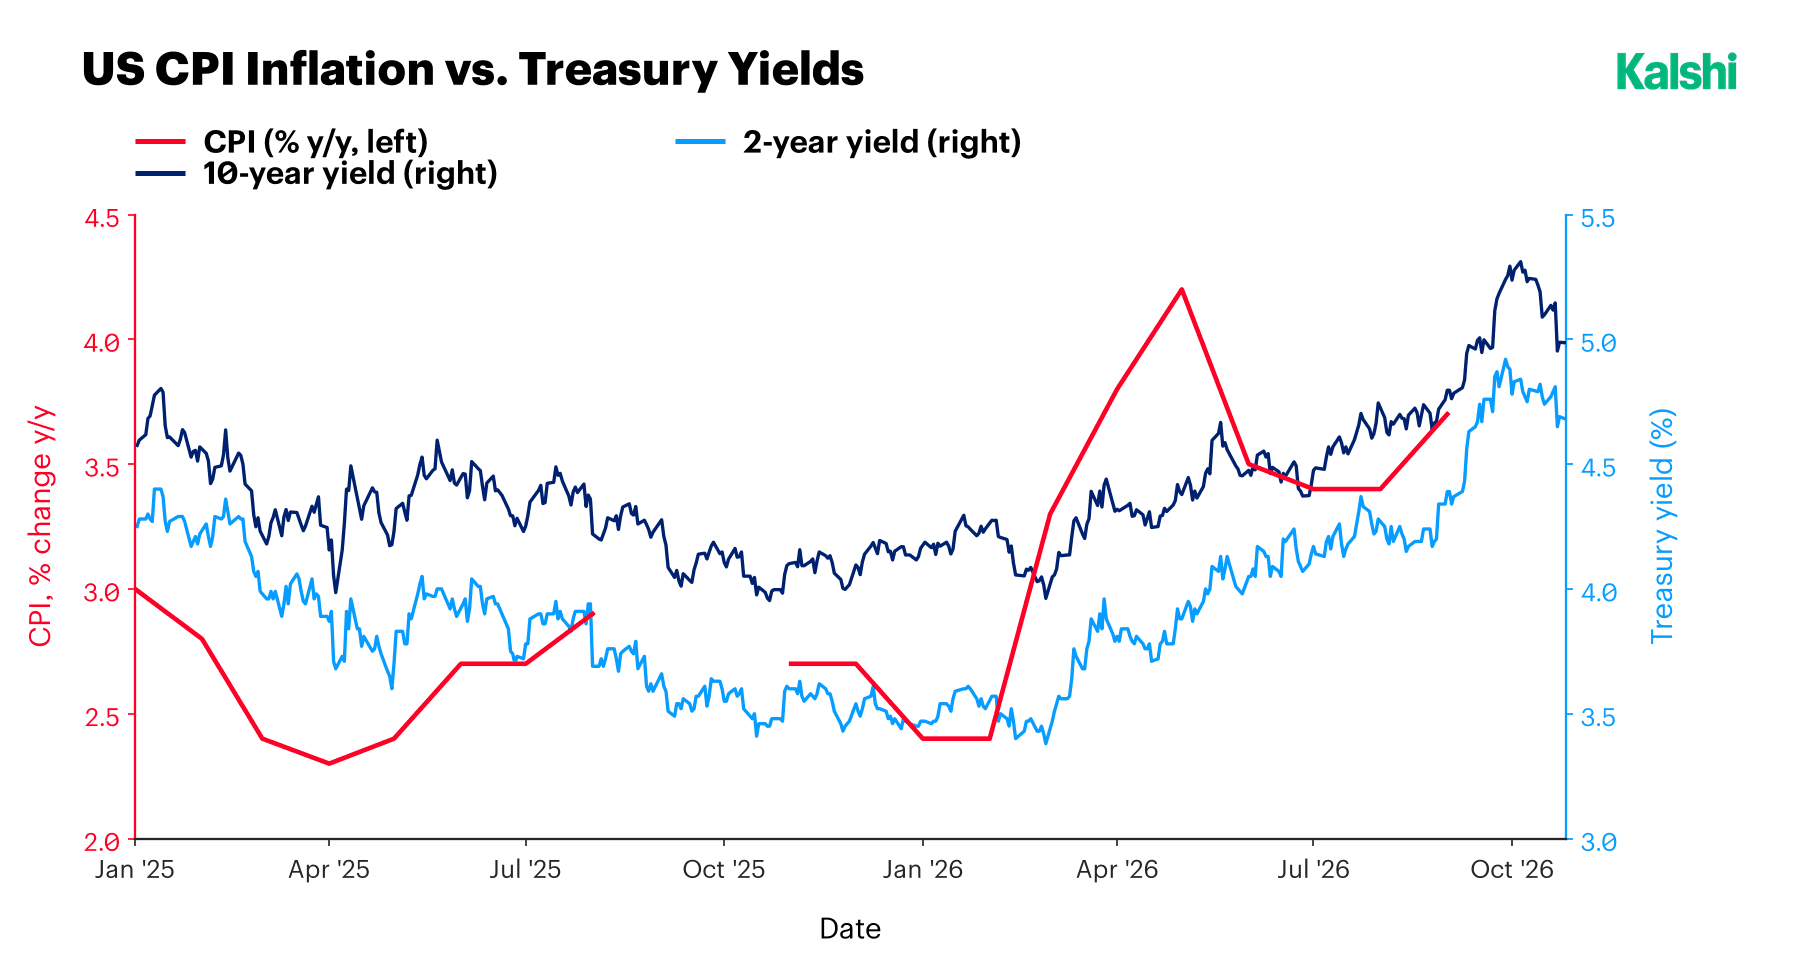
The 2-year Treasury yield tracks the expected path of policy; the 10-year adds a premium for duration and fiscal risk. When the 2-year rises faster than the 10-year, the market is repricing the Fed rather than the Treasury. That is the pattern on the chart. Reading it off the axes, the 2-year has climbed from roughly 3.5% in January to a peak near 4.9% at the start of October and about 4.7% now, while the 10-year has moved from roughly 4.1% to a peak near 5.3% and about 5.0%, a flattening of around 30bp in the 2s10s spread.
Notably, yields kept rising through the dip in CPI. Headline inflation fell from 4.2% in May to 3.4% in July and August, and the 2-year and 10-year did not follow it down. The market has been trading the Fed’s reaction function, not the latest print. The fiscal channel we flagged in September has not gone away either: the 30-year yield approached 5.7% in early October, above the 5.34% August high cited in our last note. A hold paired with two hawkish dissents is the kind of mixed signal that can leave the long end, which is already carrying a fiscal premium, with the credibility question still open.
Kalshi and Fed Funds Futures Have Moved in Lockstep, With Futures Running Slightly Hotter
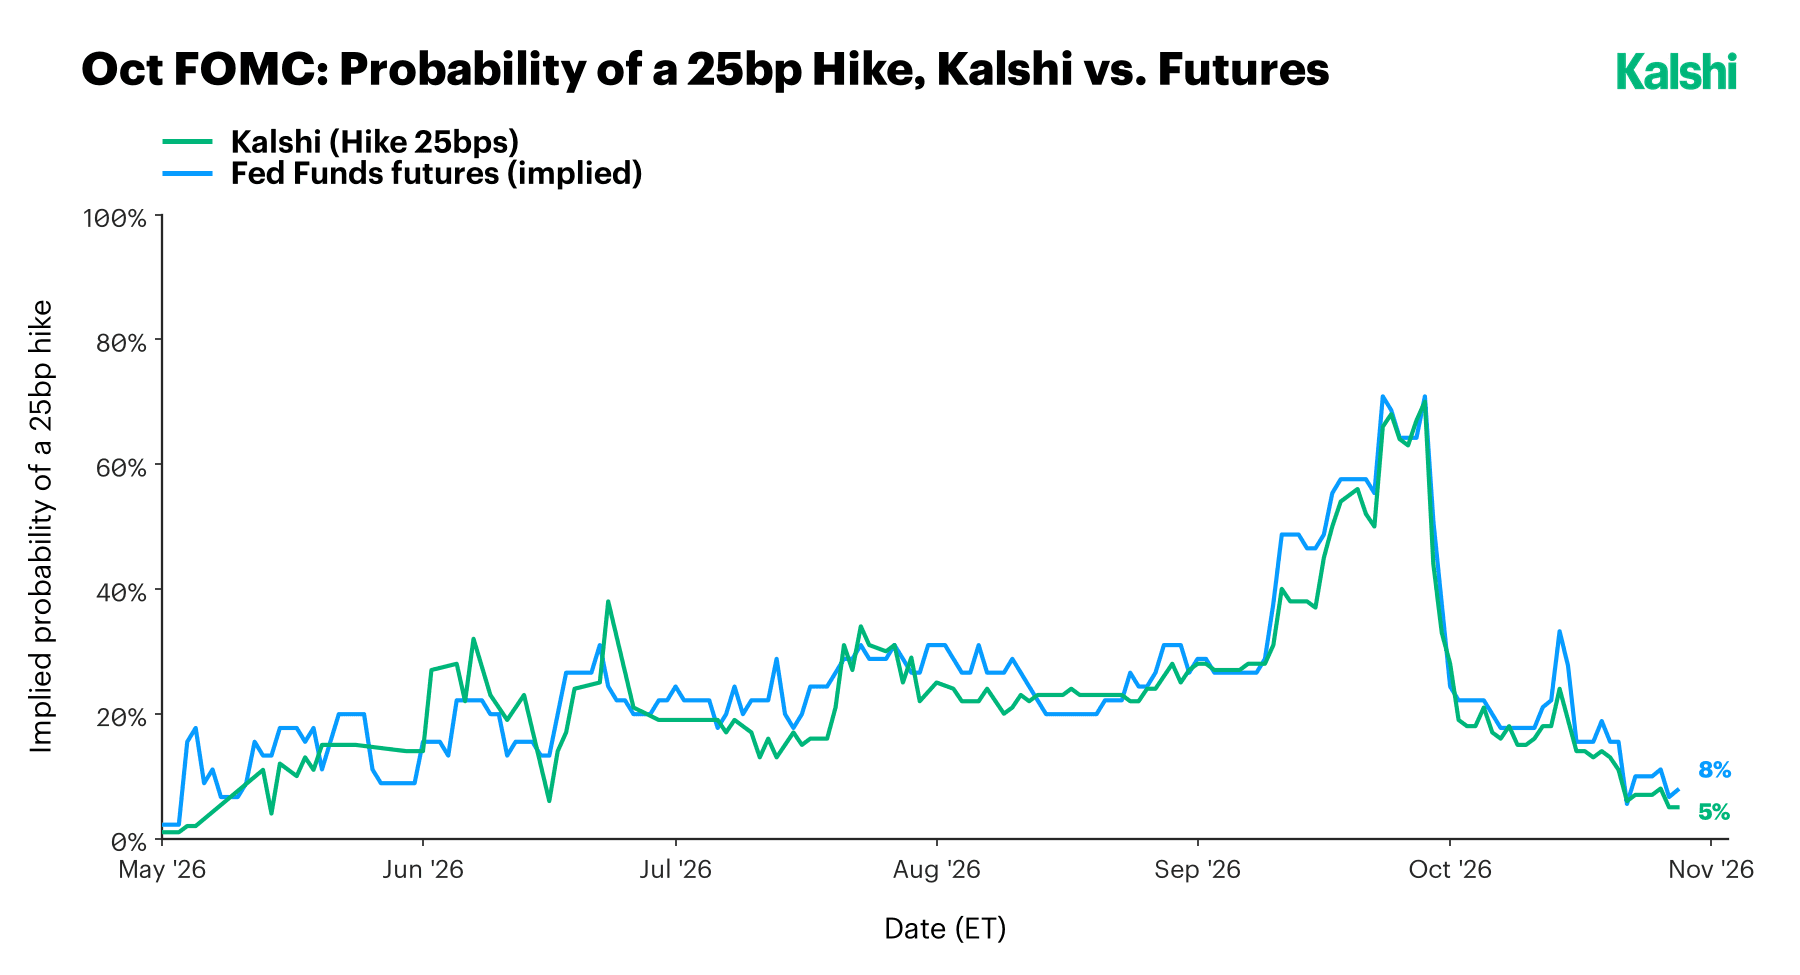
Across the October contract’s history, Kalshi and futures-implied odds have rarely been more than a few points apart, and the two peaked together near 70% in late September. The latest readings are roughly 8% from futures against 5% from Kalshi. The gap has been widest on shock days: around the October 14–15 reaction to CPI, futures-implied odds reached about a third while Kalshi peaked near 24%.
Two explanations are plausible. Futures-implied odds are backed out of an average-rate calculation that is sensitive to assumptions about hike size and timing, whereas a Kalshi contract settles on a discrete outcome. Rate hedgers may also pay up for tail protection around data releases. The data here cannot separate the two, and we would not read the gap as either market being right. What is consistent is the sign: futures ran about seven points above Kalshi into the September decision, and they are running a few points above it again.
Kalshi’s Curve Prices a December Hike and Keeps Climbing, Well Beyond the Dots
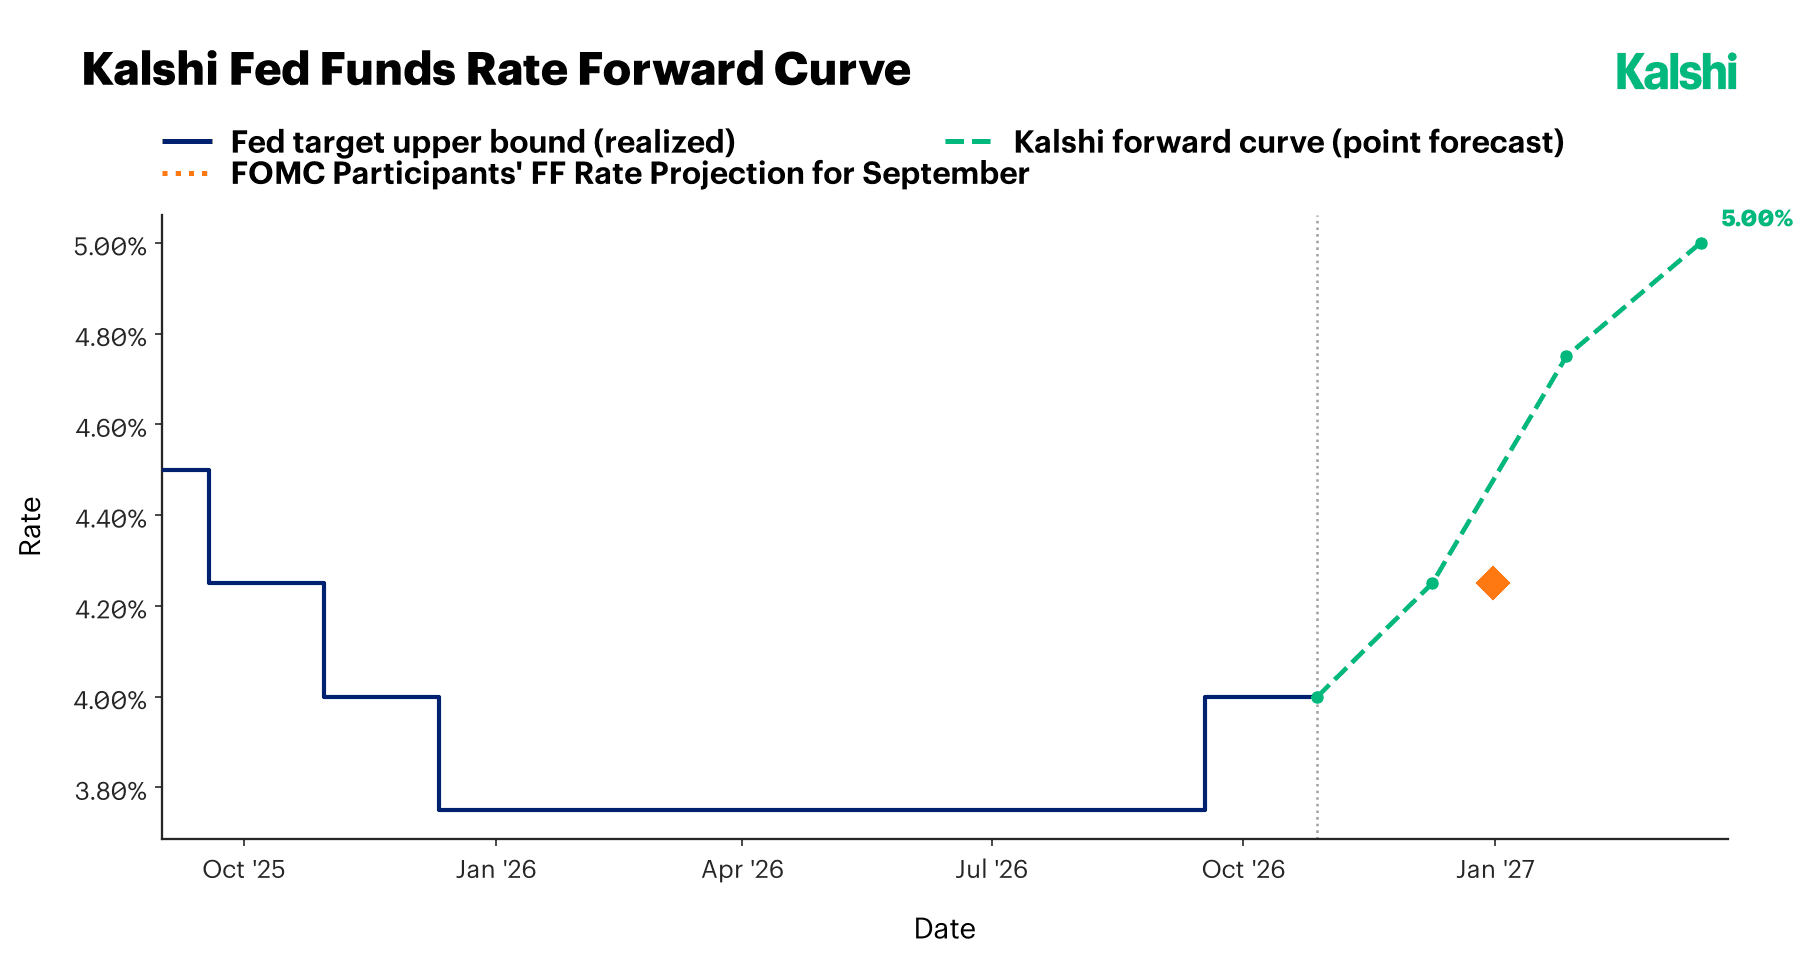
Kalshi’s forward curve for the upper bound of the target range steps from 4.00% after Wednesday’s expected hold to roughly 4.25% at the December 8–9 meeting, which is where the Committee’s own median projection ends the year. That is in line with the wider market: CME’s FedWatch tool put the probability of a December hike near 73% heading into the meeting, up from about 42% a month earlier, and Goldman Sachs and Citi both expect a hike in December, with Goldman framing it as the final move of the year. The minutes of the September meeting showed most officials expecting another increase before year-end. Kalshi’s own December 8–9 hike contract stands at 75% probability.
The curve then keeps going. Kalshi’s point forecast reaches roughly 4.75% at the January 26–27 meeting and 5.00% by March, which is 75bp above the Fed’s September median at year-end, a path on which the median participant holds flat through 2027. The Committee’s dots and the market’s curve coincide in December and diverge from there. A 50bp step between December and January is more plausibly a statement about the width of the distribution than a literal forecast of a 50bp hike: the curve is a point forecast, so a fat right tail pulls the mean up, and later-dated contracts trade at far lower volume than the October and December meetings. Nick Timiraos has noted that hot inflation readings could turn the December debate from whether to hike into whether to hike by 25bp or 50bp. Because Warsh does not submit a dot, and the median therefore reflects 18 other voices, the dots may also carry less signaling weight than they did under previous chairs.
Inflation Is Re-Accelerating Into a Softening Labor Market, and Kalshi Leans Toward the Inflation Side
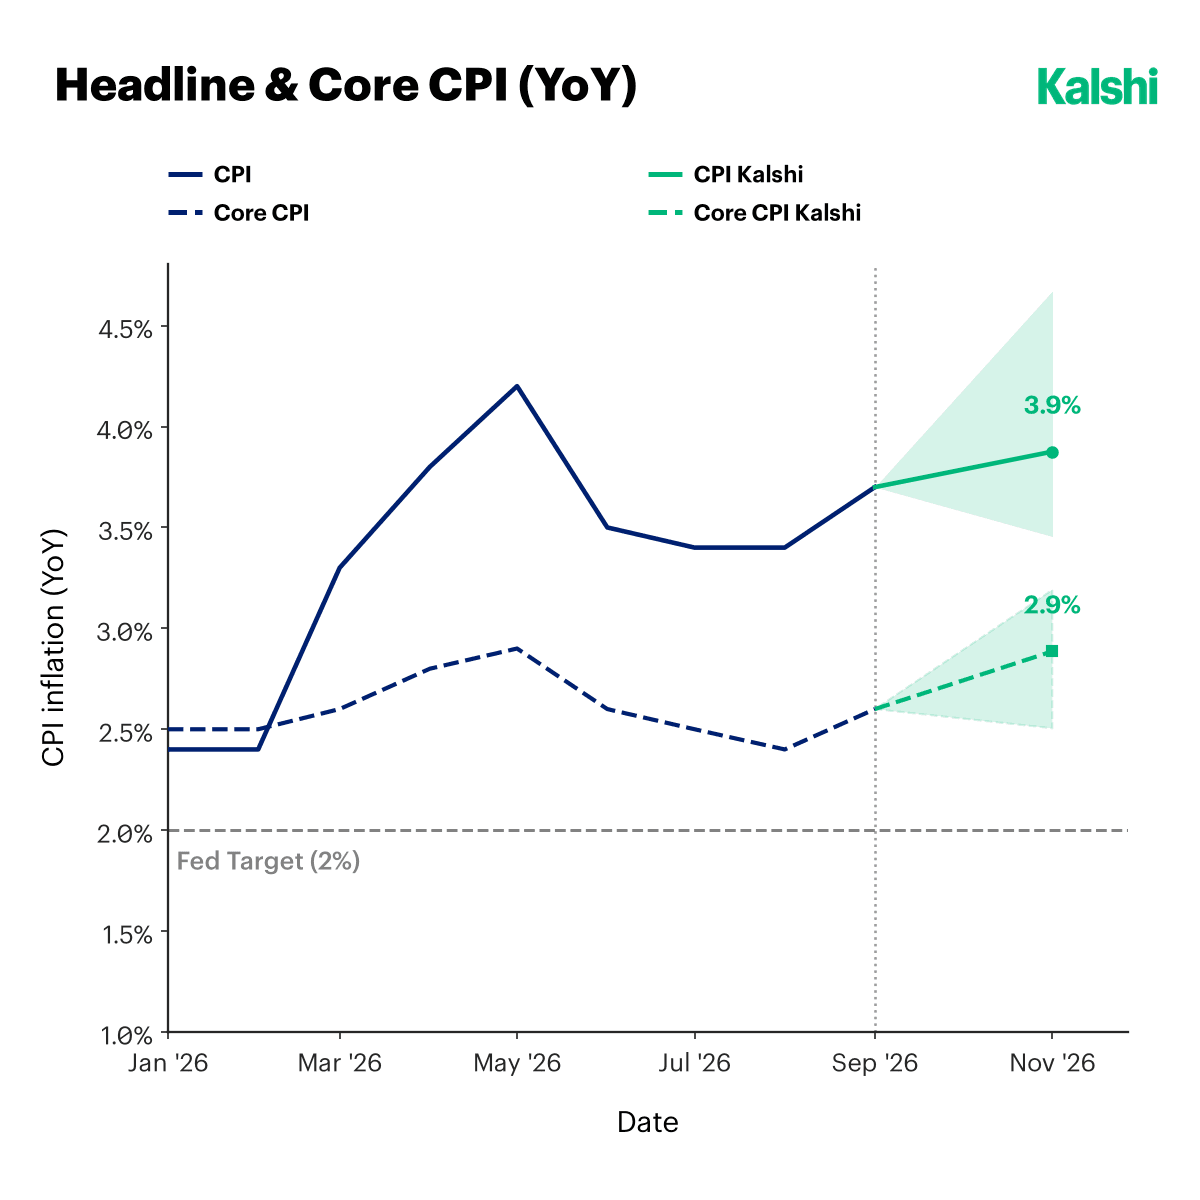
Headline CPI rose to 3.7% year over year in September from 3.4% in both July and August, against a consensus of 3.6%, with gasoline up 9.1% on the month and accounting for more than half of the monthly increase. The more consequential surprise was in core, which rose 0.3% on the month (0.33% unrounded, against 0.2% expected) and 2.6% on the year, up from August’s 2.4%, which had been its lowest since March 2021. Core goods rose 0.3% on the month, nearly triple August’s pace, and shelter rose 0.4%, helped by hotels. Edward Jones’s James McCann pointed out that core has now risen at about a 3.4% annualized pace over three months. This may be what our August 10 preview called the quiet engine under core, tariff and freight-cost pass-through beginning to show up in the data, though one month cannot establish it.
Kalshi’s markets price October headline CPI, due November 10, at 3.9% and core at 2.9%, which would match core’s spring peak, with the shaded band again skewed to the upside: roughly 3.5% to 4.7% for headline and 2.5% to 3.2% for core. The arithmetic runs through the base effect we flagged in August, now working in reverse. Gasoline fell through 2025 and ended the year near $2.83 a gallon, so each month’s year-ago comparison gets easier even if pump prices merely hold.
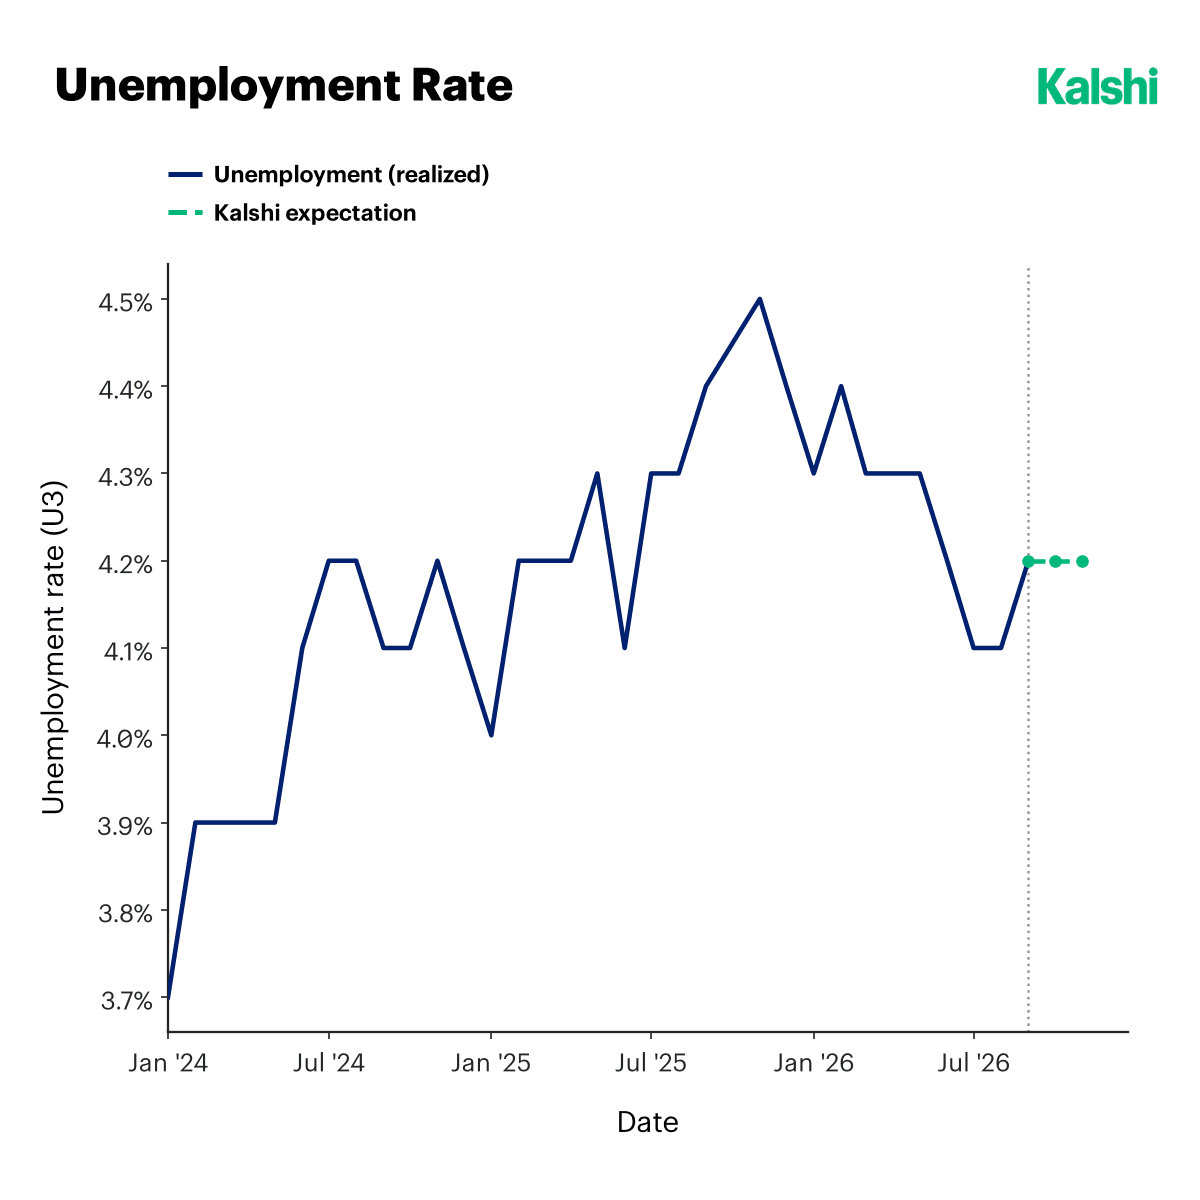
The unemployment rate rose to 4.2% in September from 4.1%, but the rise reflected a labor force that grew by 485,000 as participation climbed to 61.8%, its highest since May, rather than layoffs; household employment rose by 406,000. Kalshi’s forward contracts now price the rate flat at 4.2% over the next three prints, where in September they pointed toward 4.3%, so the market has marked down the drift higher. The rate sits above its 4.1% trough but still 0.3 points below its 4.5% peak last autumn. As in September, these longer-dated labor contracts trade at far lower volume than the FOMC contract and deserve proportionally less weight.
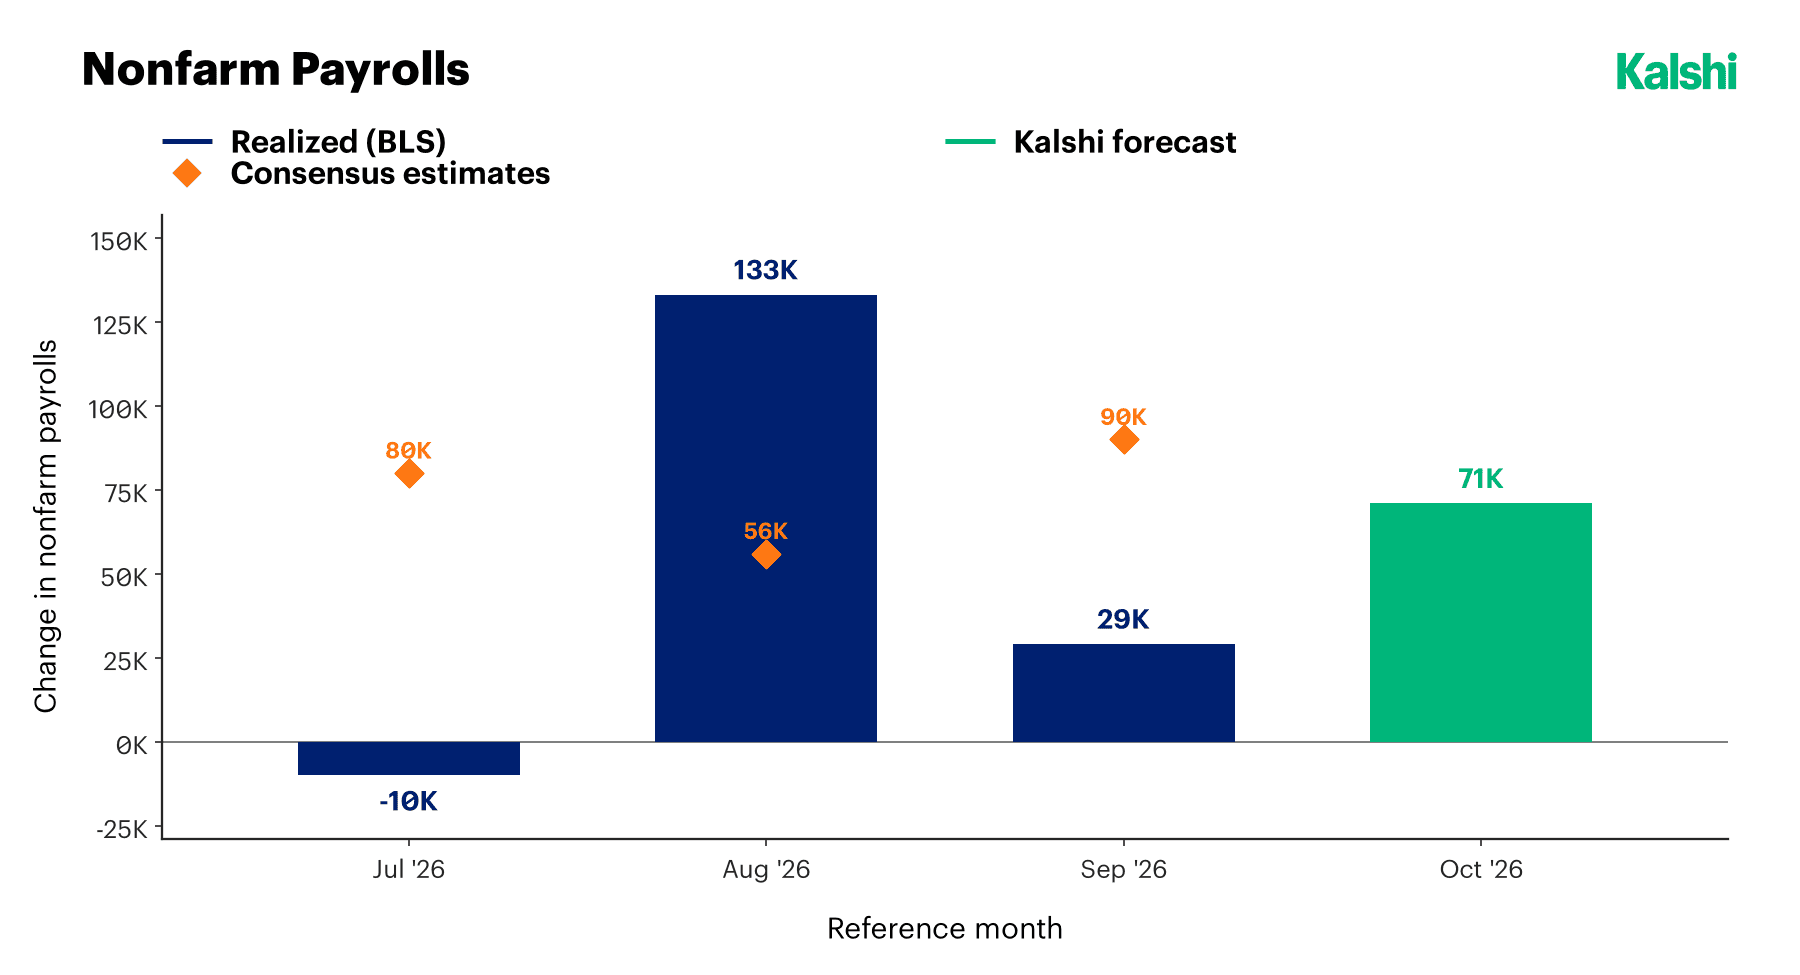
Payrolls tell a noisier story. September’s 29,000 missed the 90,000 consensus, and revisions took 60,000 jobs out of July and August combined: July now shows a loss of 10,000, and August was cut to 133,000 from 162,000, which shrinks that month’s beat against a 56,000 consensus by more than a quarter. The three-month average is roughly 51,000 and the 12-month average about 45,000. Average hourly earnings rose just 0.1% on the month, against 0.3% expected. Reuters noted that payrolls have a tendency to underperform when Labor Day falls later in September, as it did this year, which would be consistent with Kalshi’s 71,000 forecast for October, due November 6: a bounce back toward trend rather than a re-acceleration.
On the question of output, second-quarter GDP was revised up to 2.2% from 1.5%, and the advance estimate for the third quarter, due Thursday, is expected to show growth near or above 3%. Hiring that has stalled while output and prices run hot is the profile that divides the Committee, and it explains why the same data can support patience for some officials and a hike for others. It is also the same transmission puzzle we flagged in September: households locked into pandemic-era fixed-rate mortgages feel little of the tightening directly, so the earliest cracks are likelier to appear in spending on energy- and freight-exposed categories than in housing.
Oil Is Back Above $100, and Pump Prices Have Not Yet Caught Up
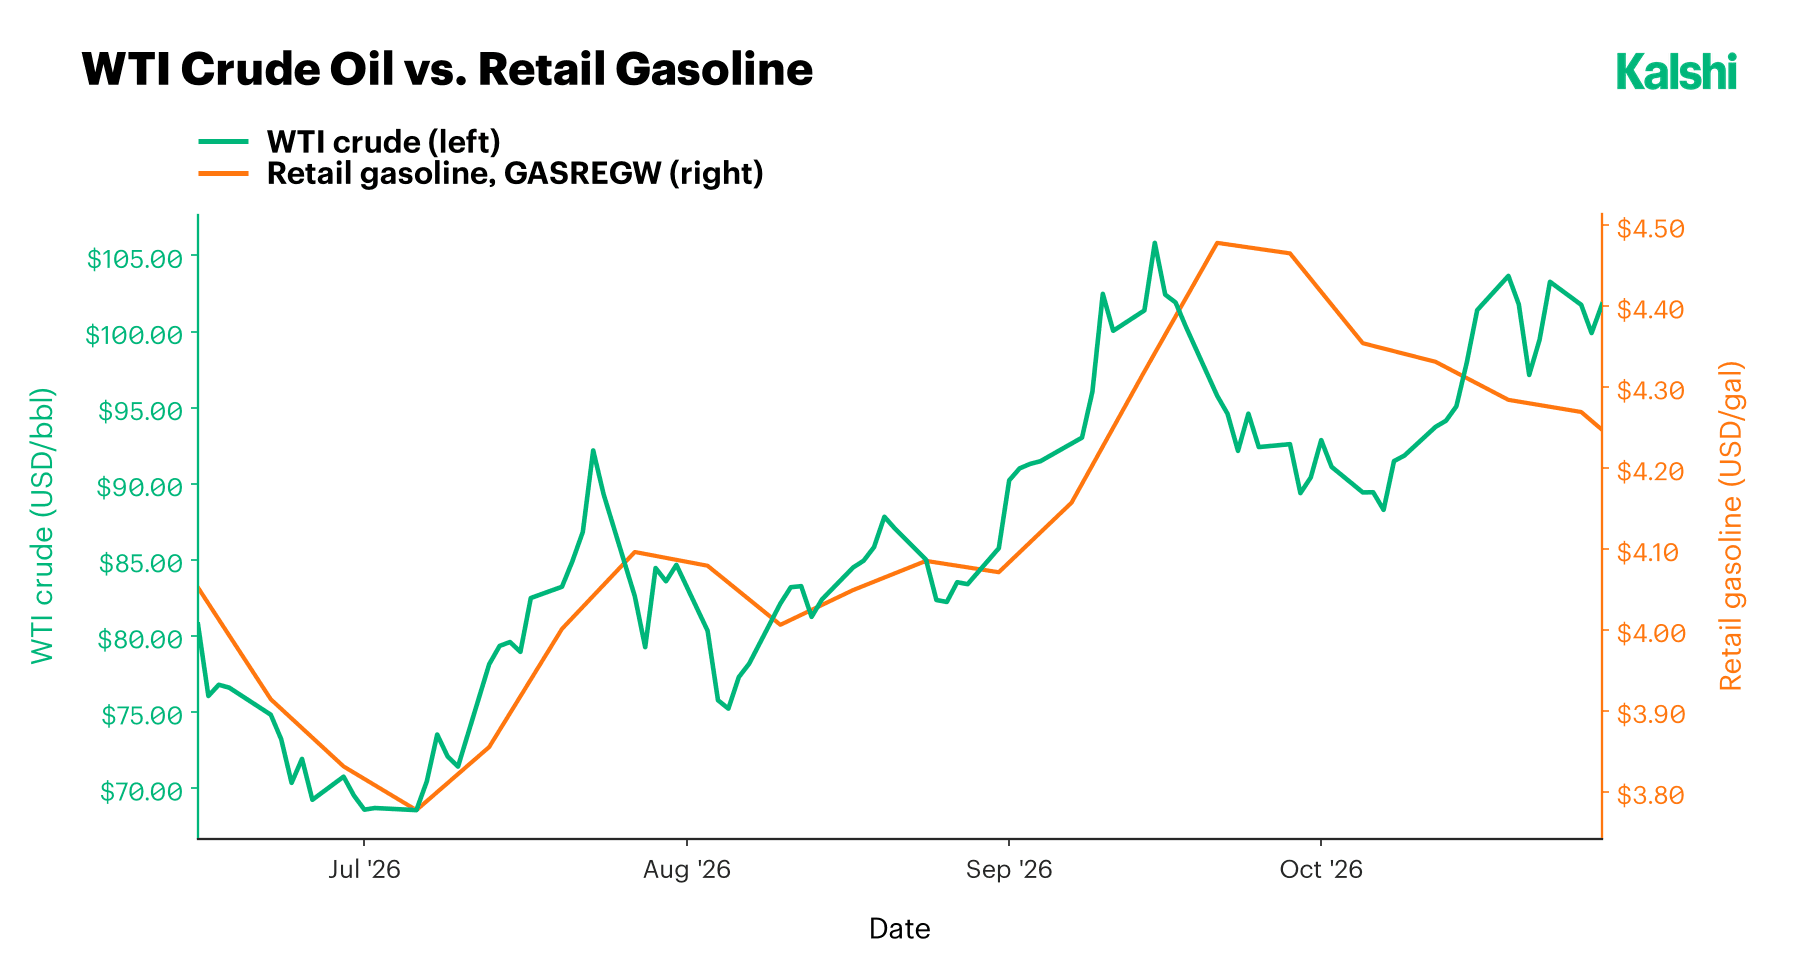
WTI crude has swung sharply. It climbed from about $68 in early July to roughly $106 in mid-September, fell to the high $80s in early October as the Hormuz situation briefly calmed, and has since recovered to about $102. Retail gasoline followed the first leg up, peaking near $4.48 in late September, but has drifted down to about $4.25 even as crude has retraced its dip. Retail prices typically trail crude with a lag of a week or two, so if crude holds near $100 the gap is likelier to close upward than downward, which is the physical arithmetic behind Kalshi’s 3.9% headline forecast.
The supply picture is better than at the worst of the blockade but not resolved. Flows through the Strait of Hormuz remain below pre-war levels, tanker insurance and freight costs remain elevated, and the U.S.–Iran channel has not produced a durable reopening agreement, though renewed diplomatic engagement this week eased immediate fears of another escalation.
This is the heart of the Committee’s disagreement. The leadership’s case for patience rests on the observation that an energy-driven rise in prices is a supply-side problem, which rate hikes address only indirectly. The hawks’ counter is that when energy costs seep into core goods, airfares and shelter, as September’s CPI hints, it stops being a supply story. Both can be right, in sequence, which is why December, with a new Summary of Economic Projections and two more CPI prints in hand, is where the argument is likelier to be settled.
The Fed Is Not Tightening Alone, and Three Other Central Banks Decide This Week
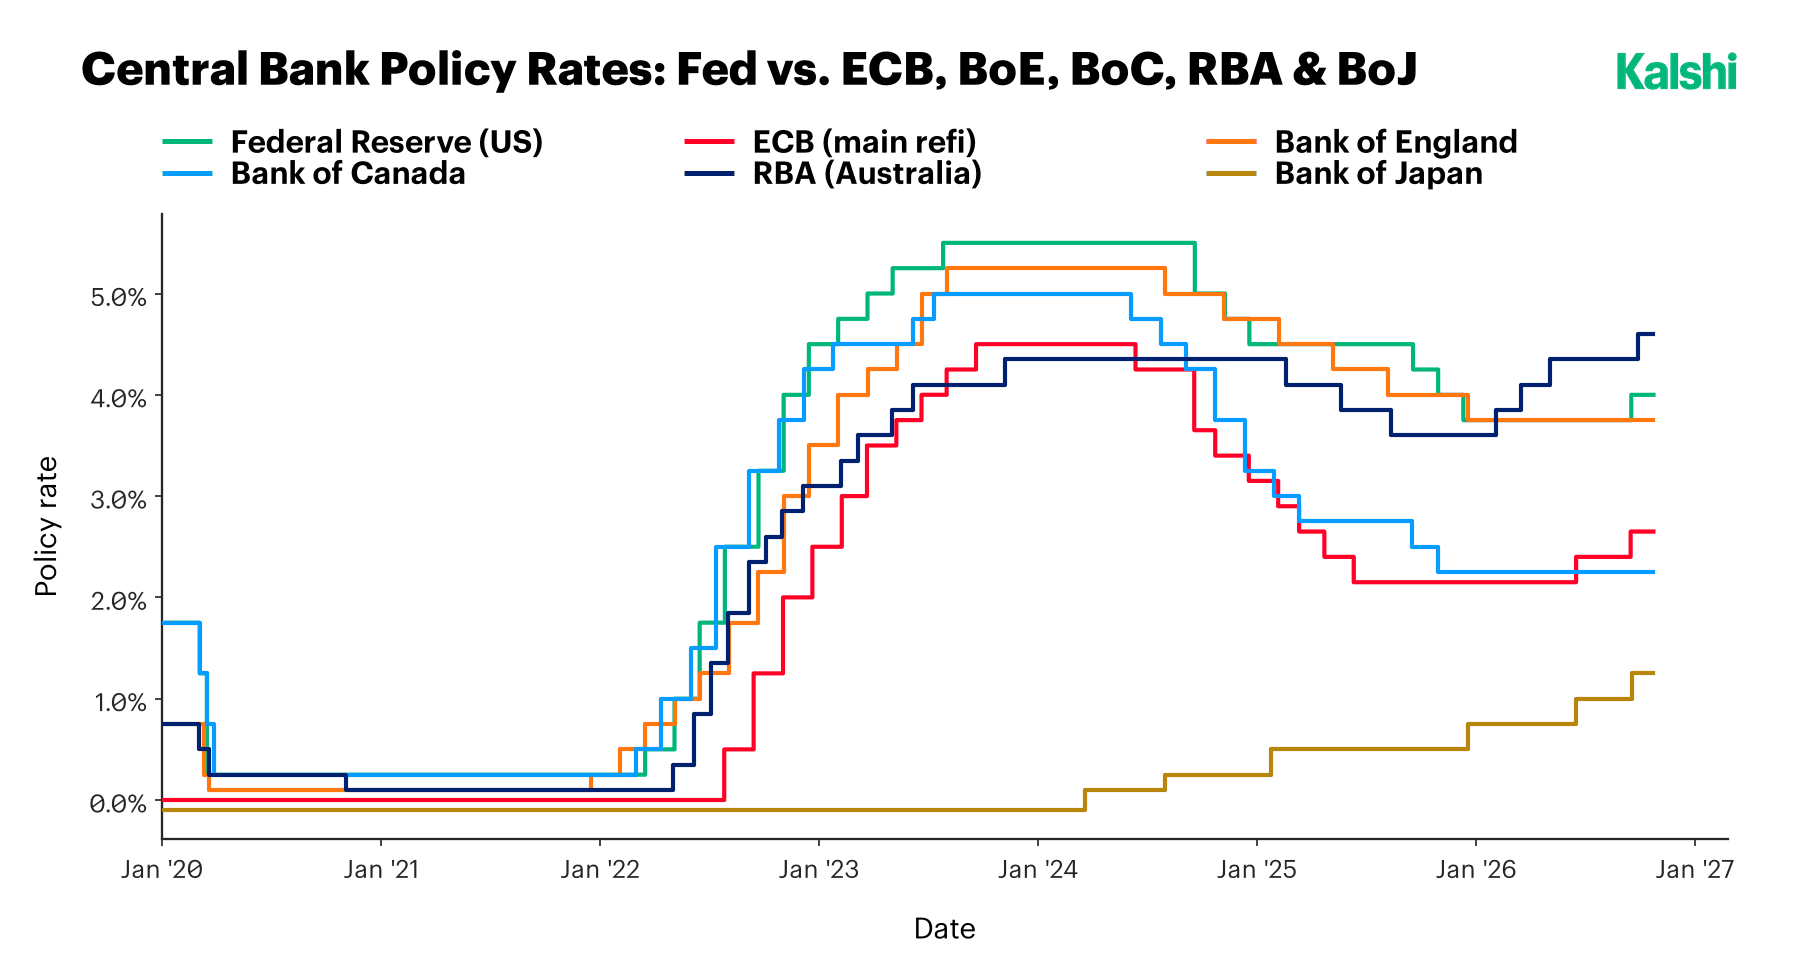
The Reserve Bank of Australia raised its cash rate 25bp to 4.60% on September 29, unanimously and to its highest level since 2011, which puts its policy rate above the Fed’s 4.00% upper bound and 85bp above the Bank of England’s 3.75%. The Bank of Japan raised to 1.25% on September 18 on a 7–2 vote, its highest since 1995, and the ECB’s main refinancing rate stands at 2.65% after its September 10 hike. The Bank of England held on a 6–3 vote. The common thread we described in our August 24 roundup, energy import dependence compounding a weak currency, still describes Japan and the Euro Area; Australia’s move is better explained by underlying inflation that has refused to ease.
Three decisions land alongside the Fed. The Bank of Canada decides today with a new Monetary Policy Report, and the market has been closely split on a first hike from 2.25%, with Desjardins expecting one and RBC a hold, even as Canada lost 68,000 jobs in September and its unemployment rate rose to 6.5%. The ECB follows on October 29, with a December hike under discussion among Governing Council members. The Bank of Japan meets on October 29–30, still the lowest policy rate in the group and, as we flagged in August, the funding leg for global carry trades; its distance from a 4.00% Fed is why a surprise from either side matters for the other.
Conclusion
Wednesday’s decision is unlikely to be the one that matters. A hold, with a near-silent statement and one or two hawkish dissents, would leave the market to infer the rest from the data and from the dots it will not see until December 8–9. Warsh has named October and December as the moments at which the Committee takes stock, and the missing data from the last government shutdown may come back to haunt them. On the evidence of this contract, October is the pause; December is the verdict.
About Kalshi Research
Signal-rich analysis of prediction markets. Questions, data access (currently free for institutional clients), or collaboration: research@kalshi.com
Disclaimer
This report is published by Kalshi Inc. (“Kalshi,” “we,” or “us”) for informational and educational purposes only. It is not investment, legal, tax, or trading advice, and it does not constitute a recommendation or solicitation to buy, sell, or hold any event contract, security, or other financial instrument. Nothing in this report creates a fiduciary, advisory, or professional-client relationship between Kalshi and the reader.
Kalshi operates a CFTC-regulated exchange. The event contracts and forward curves referenced herein are traded on or derived from Kalshi’s platform. The market prices, forward curves, and implied probabilities cited in this report reflect what market participants thought at a given moment; such data is subject to change without notice. These figures are not guarantees or predictions of actual outcomes. Past and current prices do not indicate future results. Data sourced from third parties is believed to be reliable but has not been independently verified. Third-party projections and estimates cited herein are subject to significant uncertainty and may not be realized.
Trading event contracts carries risk, including the risk that you may lose some or all of your invested capital. Event contract outcomes are binary and can result in the total loss of the amount paid for a contract. Every figure and probability here is current only as of the date of publication. Kalshi undertakes no obligation to update, revise, or correct this report after publication.
Kalshi, its affiliates, officers, directors, and employees may have financial interests in the contracts or markets discussed herein and may trade them at any time without notice to readers.
This report is not directed at any person in any jurisdiction where its distribution or the offering of event contracts would be contrary to local law or regulation. Before acting on anything in this report, consult your own independent legal, tax, financial, or other professional advisor.
This report is not insurance advice and does not constitute a recommendation regarding the purchase, renewal, or cancellation of any insurance policy or program. Comparisons between event contracts and insurance products are illustrative only and do not account for differences in regulatory protections, counterparty credit risk, claims processes, coverage scope, or policyholder rights that may apply to traditional insurance. Readers should consult a licensed insurance professional before making decisions about their insurance or risk-transfer arrangements.
Get new Kalshi Research publications and insights as they are released.